Reports
Secure60’s flexible reporting system enables organisations to create custom dashboards and reports using a powerful JSON-based configuration system. Reports are built through the Portal UI and support multiple chart types, data sources, and visualisation options.
Report Configuration
Component Structure
Each report consists of multiple components, where each component is defined by a JSON configuration with three main areas:
- Layout - Controls where on the report the component is positioned and rendered
- Chart - Controls what chart component type is displayed and its visual style/UI properties
- Data - Describes the backend API query type and parameters to retrieve data for display
Flexible Data Queries
The Data section supports all backend API call types with endless flexibility. You can add any items to the JSON object (like "query", "aggregation", "time_range", etc.) which become GET parameters in the backend query, allowing you to construct exactly the data request you need.
Portal UI Configuration
- Visual Report Builder - Create and modify reports through the web interface
- JSON Editor - Direct JSON editing for advanced configurations
- Preview Mode - Real-time preview of report changes
- Template Library - Pre-built report templates for common use cases
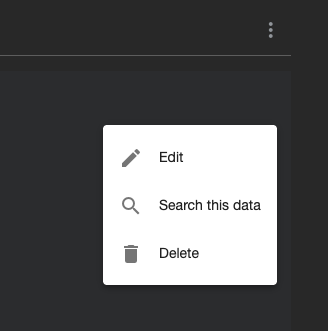
Report editor menu items
Use the report editor menu to access component editing, layout/configuration options, and report management actions.
Example Report
Here’s an example of a comprehensive Host Analysis Report showing the various chart types and layout capabilities:
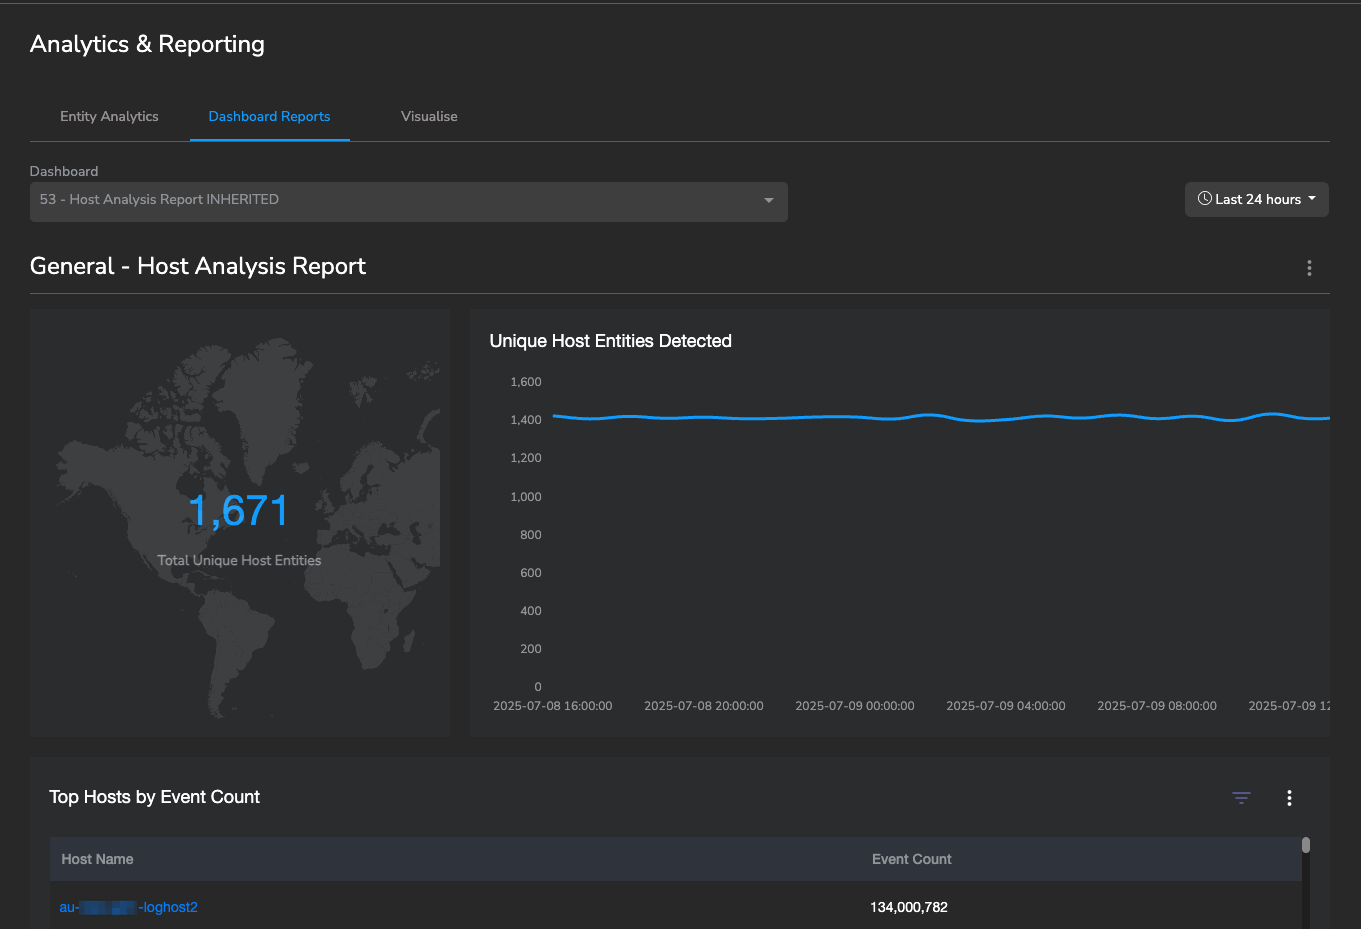
Chart Types
Data Table (datatable)
Interactive tables displaying structured data with sorting, filtering, and export capabilities.
Features:
- Custom column configuration with titles and field mappings
- Number formatting and display options
- Search integration with clickable links to detailed views
- Common fields filtering for event data
- CSV export functionality
- Configurable row limits
Example Configuration:
{
  "chart": {
    "title": "Top Hosts by Event Count",
    "type": "datatable",
    "visible_rows": "10",
    "columns": [
      {
        "title": "Host Name",
        "field_name": "host_name",
        "add_link_to_search": "Y"
      },
      {
        "title": "Event Count",
        "field_name": "_count",
        "display_number_formatted": "Y"
      }
    ],
    "show_common_fields_filter": "Y"
  }
}
Configuration Options:
- visible_rows - Number or “all”. Rows before scrolling; “all” disables internal scroll.
- show_common_fields_filter - “Y”|“N”. Show common fields filter (for
events_detail). - nest_by_organisation - “Y”|“N”. Group rows by organisation, preserving parent/child order.
- nesting_indent_px - Number. Indent per nesting level when grouping by organisation.
Column Options:
- field_name - Data field key.
- title - Column header label.
- add_link_to_search - “Y”|“N”. Link value to portal search for that field.
- link_url - Custom link template; supports
{{value}}placeholder. - display_number_formatted - “Y”|“N”. Format numbers with thousands separators.
- integer_number_format - “Y”|“N”. Format large integers as K/M/B.
- byte_storage_format - “Y”|“N”. Format bytes to KB/MB/GB/TB.
- add_detail_pullout - “Y”|“N”. Show detail pullout with actions (e.g., Investigate Item).
- add_list_detail_pullout - “Y”|“N”. Also enables pullout; exposes Add to List.
- display_total_footer - “Y”|“N”. Show a footer aggregation for this column.
- display_total_footer_aggregation - “sum”|“avg”|“min”|“max”. Aggregation type; defaults to “sum”.
Behavior Notes:
- Footer aggregations compute client-side over the current table data (post filter), not only visible rows.
- Reserved numeric fields like
_countand_totalrender without links. - CSV export is available from the table actions menu and does not include the footer row.
- When
nest_by_organisationis enabled, group-by fields may be augmented internally to include organisation identifiers for correct grouping.
Footer Aggregation Example:
{
  "title": " Count",
  "field_name": "_count",
  "add_link_to_search": "N",
  "display_number_formatted": "Y",
  "display_total_footer": "Y",
  "display_total_footer_aggregation": "avg"
}
Line Chart (linechart)
Time-series visualisations for trend analysis and temporal data patterns.
Features:
- Customisable line colours and backgrounds
- Time-based X-axis with automatic scaling
- Responsive design with grid controls
- Interactive tooltips and hover effects
Example Configuration:
{
  "chart": {
    "title": "Unique Host Entities Detected",
    "type": "linechart",
    "line_colour": "#585687",
    "background_colour": "#000000",
    "x_data_fieldname": "_timestamp_timezone",
    "y_data_fieldname": "_count"
  }
}
Bar Chart (barchart)
Vertical bar charts for categorical data comparison and analysis.
Features:
- Customisable bar colours and hover effects
- Automatic data scaling and axis formatting
- Responsive design with configurable spacing
- Support for categorical and numerical data
Configuration Options:
- x_data_fieldname - Field for category labels (X-axis)
- y_data_fieldname - Field for numeric values (Y-axis)
- background_colour - Chart background colour
- Custom styling - Bar spacing, border radius, and colour schemes
Example Configuration:
{
  "chart": {
    "title": "Events by Source Type",
    "type": "barchart",
    "background_colour": "#000000",
    "x_data_fieldname": "source_type",
    "y_data_fieldname": "_count"
  }
}
Pie Chart (piechart)
Circular charts displaying proportional data and percentage distributions.
Features:
- Automatic colour palette with customisable schemes
- Interactive legends with data labels
- Proportional segment sizing
- Responsive design with hover effects
Configuration Options:
- x_data_fieldname - Field for category labels
- y_data_fieldname - Field for numeric values
- Custom colours - Predefined colour schemes for segments
- Legend display - Configurable legend positioning
Example Configuration:
{
  "chart": {
    "title": "Event Distribution by Category",
    "type": "piechart",
    "x_data_fieldname": "event_category",
    "y_data_fieldname": "_count"
  }
}
Total Chart (totalchart)
Single metric displays for key performance indicators and summary statistics.
Features:
- Large numeric displays with formatting options
- Colour customisation for text and backgrounds
- Percentage and decimal formatting
- Comparison indicators
Example Configuration:
{
  "chart": {
    "title": "Total Unique Host Entities",
    "type": "totalchart",
    "text_colour": "#585687",
    "background_colour": "#000000",
    "display_number_formatted": "Y"
  }
}
Text Panel (textpanel)
HTML content panels for displaying formatted text, instructions, and contextual information.
Features:
- HTML content rendering with full formatting support
- Custom text styling and layout options
- Static content display for report context
- Rich text formatting capabilities
Configuration Options:
- title - Panel title
- text_content - HTML content to display
- Custom styling - Text formatting and layout controls
Example Configuration:
{
  "chart": {
    "title": "Report Overview",
    "type": "textpanel",
    "text_content": "<p>This report provides <strong>comprehensive analysis</strong> of host activity patterns.</p><ul><li>Entity tracking</li><li>Event correlation</li><li>Performance metrics</li></ul>"
  }
}
Layout Configuration
The Layout section controls component positioning using a grid-based system:
- row_start/row_finish - Vertical positioning within the report
- column_start/column_finish - Horizontal positioning and span
Example:
{
  "layout": {
    "row_start": "1",
    "row_finish": "1",
    "column_start": "2",
    "column_finish": "3"
  }
}
Data Configuration
The Data section describes the backend API query and supports all API call types with complete flexibility. Any parameters you add become GET parameters in the backend request.
Common Data Types
- events_detail - Individual event records with full field access
- events_summary - Aggregated event data over time periods
- entities_detail - Entity-specific data with relationship information
- entities_summary - Entity metrics and trends
- threats_admin - Threat intelligence and administrative data
Flexible Parameters
Add any parameters to customize your data query - they all become GET parameters:
- query - Secure60 query syntax for data filtering
- query_group_by_fields - Fields for data aggregation
- query_group_distinct - Distinct value counting
- aggregation - Statistical functions (sum, count, avg, etc.)
- query_max_age_time - Time-based filtering (e.g., “24-h”, “7-d”)
- list_allow_field/list_allow_id - List-based filtering
- query_addition - Appended to
querywith AND (e.g., static source filters) - paginate_count - Page size used by table data fetchers
- resource_type - Contextual scope (e.g., “organisation”, “project”)
- include_child_organisations - “Y”|“N”; include descendant organisations in queries
- Any custom parameter - Gets passed directly to the backend API
Example:
{
  "data": {
    "data_type": "entities_detail",
    "query": "_entity_name='host_name'",
    "aggregation": "sum",
    "query_group_by_fields": "_entity_name",
    "query_group_distinct": "_entity_value"
  }
}
Interactive Features
Search Integration
- add_link_to_search - Generate direct links to search results
- Entity Search - Specialised entity lookup queries
- Custom URL Generation - Flexible link generation with parameters
List Integration
- add_list_detail_pullout - Integration with Secure60 Lists
- Add to List - Direct addition of values to threat intelligence lists
- List Filtering - Use lists as allow/deny filters in reports
Analysis Tools
- Investigate Item - Deep analysis of specific field values
- JSON Viewer - Detailed data inspection capabilities
- Export Functions - CSV export with custom formatting
Report Templates
Host Analysis Report
Comprehensive host monitoring and entity analysis:
- Total Chart - Total unique host entities count
- Line Chart - Host entity trends over time
- Data Table - Top hosts by event count with search integration
- Text Panel - Report overview and methodology
Security Operations Dashboard
Daily security operations metrics:
- Bar Chart - Event volume by source type
- Pie Chart - Event distribution by category
- Line Chart - Alert trends over time
- Total Chart - Critical incidents count
Network Traffic Analysis
Network activity monitoring and analysis:
- Bar Chart - Top source/destination IP addresses
- Pie Chart - Protocol distribution
- Data Table - Detailed connection records
- Line Chart - Bandwidth utilisation trends
Compliance Reporting
Audit-ready compliance data:
- Data Table - Access control violations with export functionality
- Total Chart - Policy compliance percentage
- Bar Chart - Audit findings by category
- Text Panel - Compliance framework details
Best Practices
Report Design
- Clear Titles - Use descriptive chart titles and labels
- Logical Layout - Arrange charts in a logical flow for analysis
- Consistent Styling - Maintain consistent colours and formatting
- Performance - Optimise queries for large datasets
Data Strategy
- Appropriate Aggregation - Use suitable aggregation levels for the analysis
- Time Ranges - Select relevant time periods for the data being analysed
- Query Optimisation - Write efficient queries to minimise load times
- Field Selection - Include only necessary fields in table displays
User Experience
- Interactive Elements - Leverage search links and filtering capabilities
- Export Options - Provide CSV export for further analysis
- Responsive Design - Ensure reports work well on different screen sizes
- Documentation - Include clear descriptions of report purposes
For detailed configuration examples and advanced features, contact our support team or refer to the built-in template library within the Portal UI.