Search
Overview
Search is your window into every event, signal and threat Secure60 has ingested. Use it to investigate an incident, hunt for suspicious activity, validate a detection, or just answer “what happened?”. The page pairs a guided Query Helper with a fast results explorer — a colour-coded log view, an interactive timeline, a browsable Query Builder panel, and one-click actions to filter, build rules, and export.
Everything you do is captured in the page URL, so any view you build can be shared as a link or saved as a View and returned to later.
Search uses the Secure60 query language throughout. This page covers the interface; for the full grammar (operators, wildcards, regex, functions, grouping) see the Query Syntax reference.
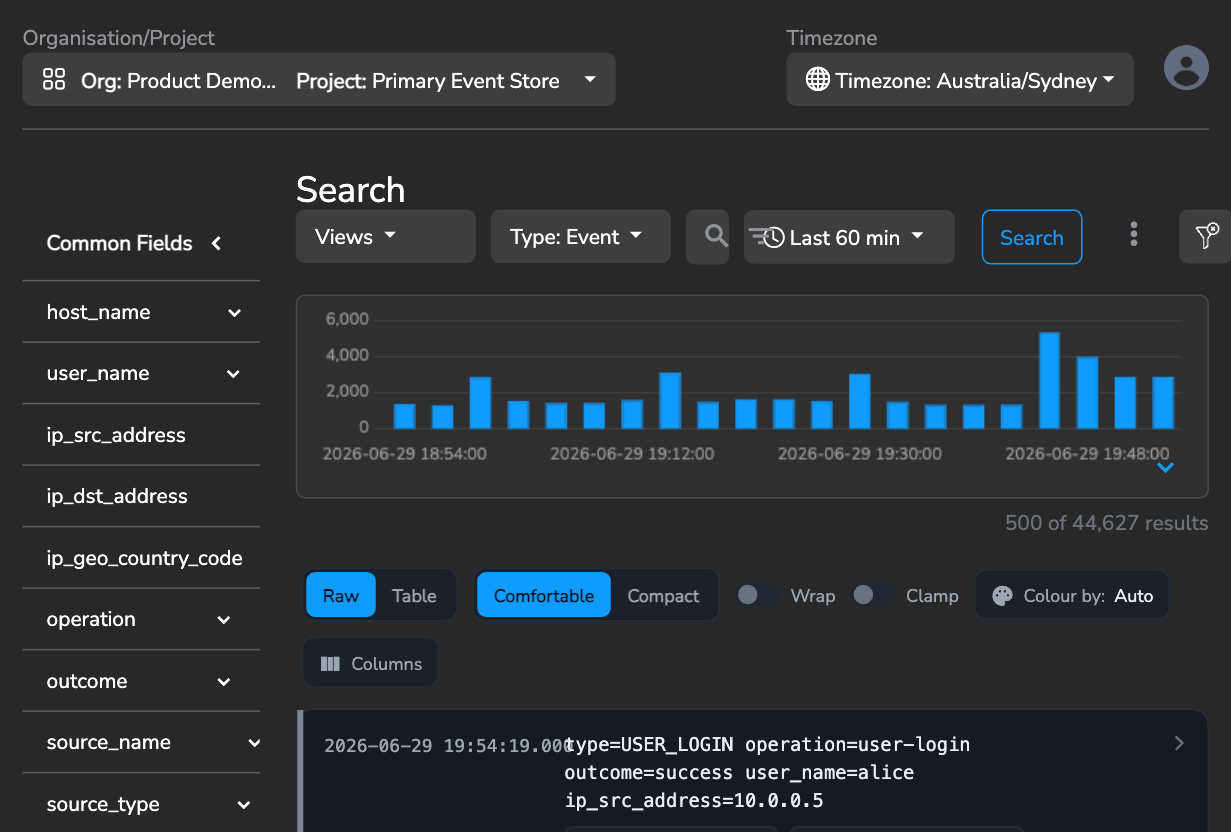
The Search page — query bar and histogram up top, the Query Builder panel on the left, and colour-coded results with the layout toolbar.
1. The query bar
The bar across the top is where you scope a search:
- Views — save the current search (query, filters, columns, layout, colour) as a named View, update or delete an existing one, or load one. An unsaved-changes dot appears when your live view differs from the loaded one. See Saved Views.
- Type — choose what you’re searching: Event, Signal, or Threat (plus organisation-wide variants on federated deployments).
- Search query — click to open the Query Helper (below). You can also just type.
- Time range — a relative window (e.g. Last 60 min, Last 24 h) or a custom from/to range. The histogram and the time picker stay in sync.
- Search — runs the query. The ⋮ menu holds Export options, and Clear resets all filters.
2. The Query Helper (autocomplete)
Clicking the query box opens the Query Helper, an inline assistant that walks you through Secure60 query syntax one token at a time — you never have to memorise the grammar. (It is distinct from the Query Builder panel on the left, which explores your data field-by-field; see below.)
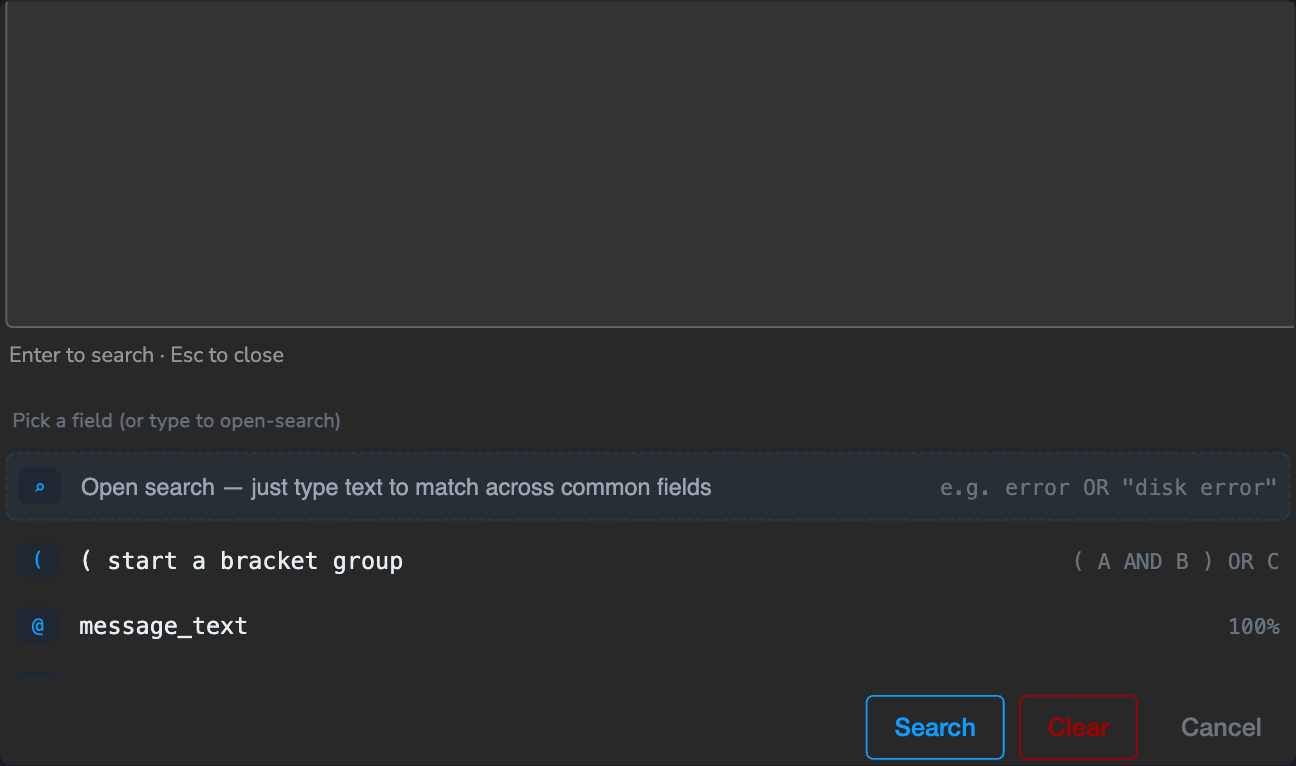
The Query Helper suggests fields, operators and values in turn, and offers open-search, grouping and functions.
As you build, the suggestions change to match where your cursor is:
- Pick a field — fields are discovered from the data in your current results (each shown with a presence %), plus the functions
isField,isIPAddressInRangeandisInList. - Choose an operator —
=exact,:contains (inserts'%%'ready for your term),!=/!:negations,>>=<<=numeric, and~for RE2 regex (pre-fills'(?i)'for case-insensitive). - Enter a value — single quotes denote a field value (
user_name = 'admin'). - Combine — add AND / OR, and group with brackets: pick ( start a bracket group, add your conditions, then ) close group — e.g.
( host_name = 'a' AND outcome = 'failure' ) OR severity = 'high'. - Open search — you don’t have to name a field at all. Just type text to match across the common fields (
message_text, host_name, ip_src_address, ip_dst_address, user_name). Multiple words are AND-ed; use double quotes for an exact phrase — e.g.error OR "disk full".
Press Enter to run, Esc to close. The full grammar is documented under Query Syntax.
Two kinds of filter. The text you build here is the query. Quick filters you add from the field rail or a result row are kept separately as removable filter chips (shown beneath the bar) and combined with your query automatically.
3. The Query Builder panel
The panel on the left lets you explore your data field-by-field without writing any query:
- Expand a field to see its top values with counts (e.g. the most common
host_names oroutcomes in the current results). - Filter TO / Filter NOT — tick one or more values, then use the ADD TO QUERY buttons inside the expanded field. They stay in place while the field is open, greyed out until you tick something, so the list never jumps under the cursor. Selections become a filter chip beneath the search bar and the search re-runs.
- Break the chart down by this field — send the field to the histogram as a group-by.
- Add as column — promote a field to a results column (the spreadsheet icon).
- Add custom field — type any field name to inspect or add it, even if it isn’t in the suggested list.
Several values of one field combine into a single clause: included values are OR-ed (any of these), excluded values are AND-ed (none of these).
4. The timeline histogram
The histogram shows event volume over your selected time range.
- Brush to zoom — drag across the bars to narrow the time range to that window.
- Click a bar to jump to that bucket.
- Chart modes — switch between histogram, line and stacked-area.
- Split the chart by a field — add a group-by from the Query Builder panel, the Columns panel, or the histogram’s own Filters panel. Splits add up rather than replace, to a maximum of four, and each one shows as a removable GROUP BY chip in the histogram header.
- Filter from the legend — with exactly one field applied, clicking a legend entry filters the search to that series. With two or more, the series names join the fields together and cannot be split back apart, so the legend click is inert and a Legend filter off note explains why.
- More actions (⋮) — Add to Report to pin the chart to a dashboard, or Create Rule to turn the current query + grouping into a detection rule.
5. The results explorer
The results toolbar controls how rows are displayed; the choices persist in the URL and in saved Views.
- Raw / Table — Raw shows each event as its log line plus a capped line of high-signal meta pills; Table shows explicit columns you choose.
- Comfortable / Compact — row density.
- Wrap / Clamp — let long content wrap fully, or clamp it to a few lines (per-column wrap is also available from the Columns tray).
- Colour by — every row carries a left severity rail. Auto derives the colour from the best available field (
alert_severity,alert_level,outcome,http_status_code,syslog_severity, …); you can also colour by a specific field, or turn it Off. The detail panel always states the resolved severity in words.
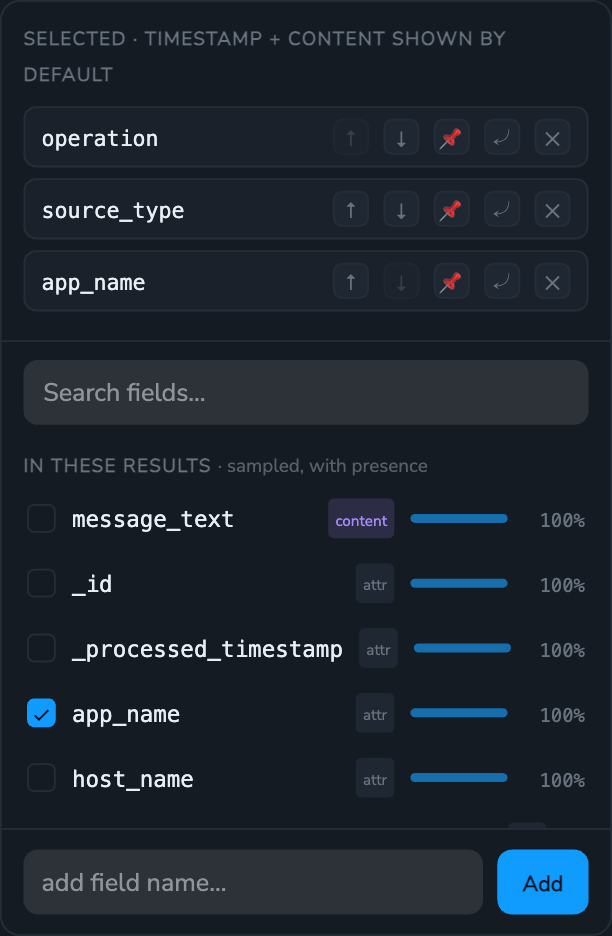
The Columns picker — choose fields (with presence %), reorder, pin (freeze-left), set per-column wrap, or add any field by name.
Columns
In Table mode, Columns opens a picker that lists the fields actually present in your results (with presence %), the CIM catalogue, and a free-text box to add any field by name. The Selected tray lets you reorder, pin (freeze-left), set per-column wrap, and remove columns. Timestamp stays pinned; the table scrolls horizontally for wide column sets. Sort by clicking a column header.
6. Investigating an event
Click any row to expand it.
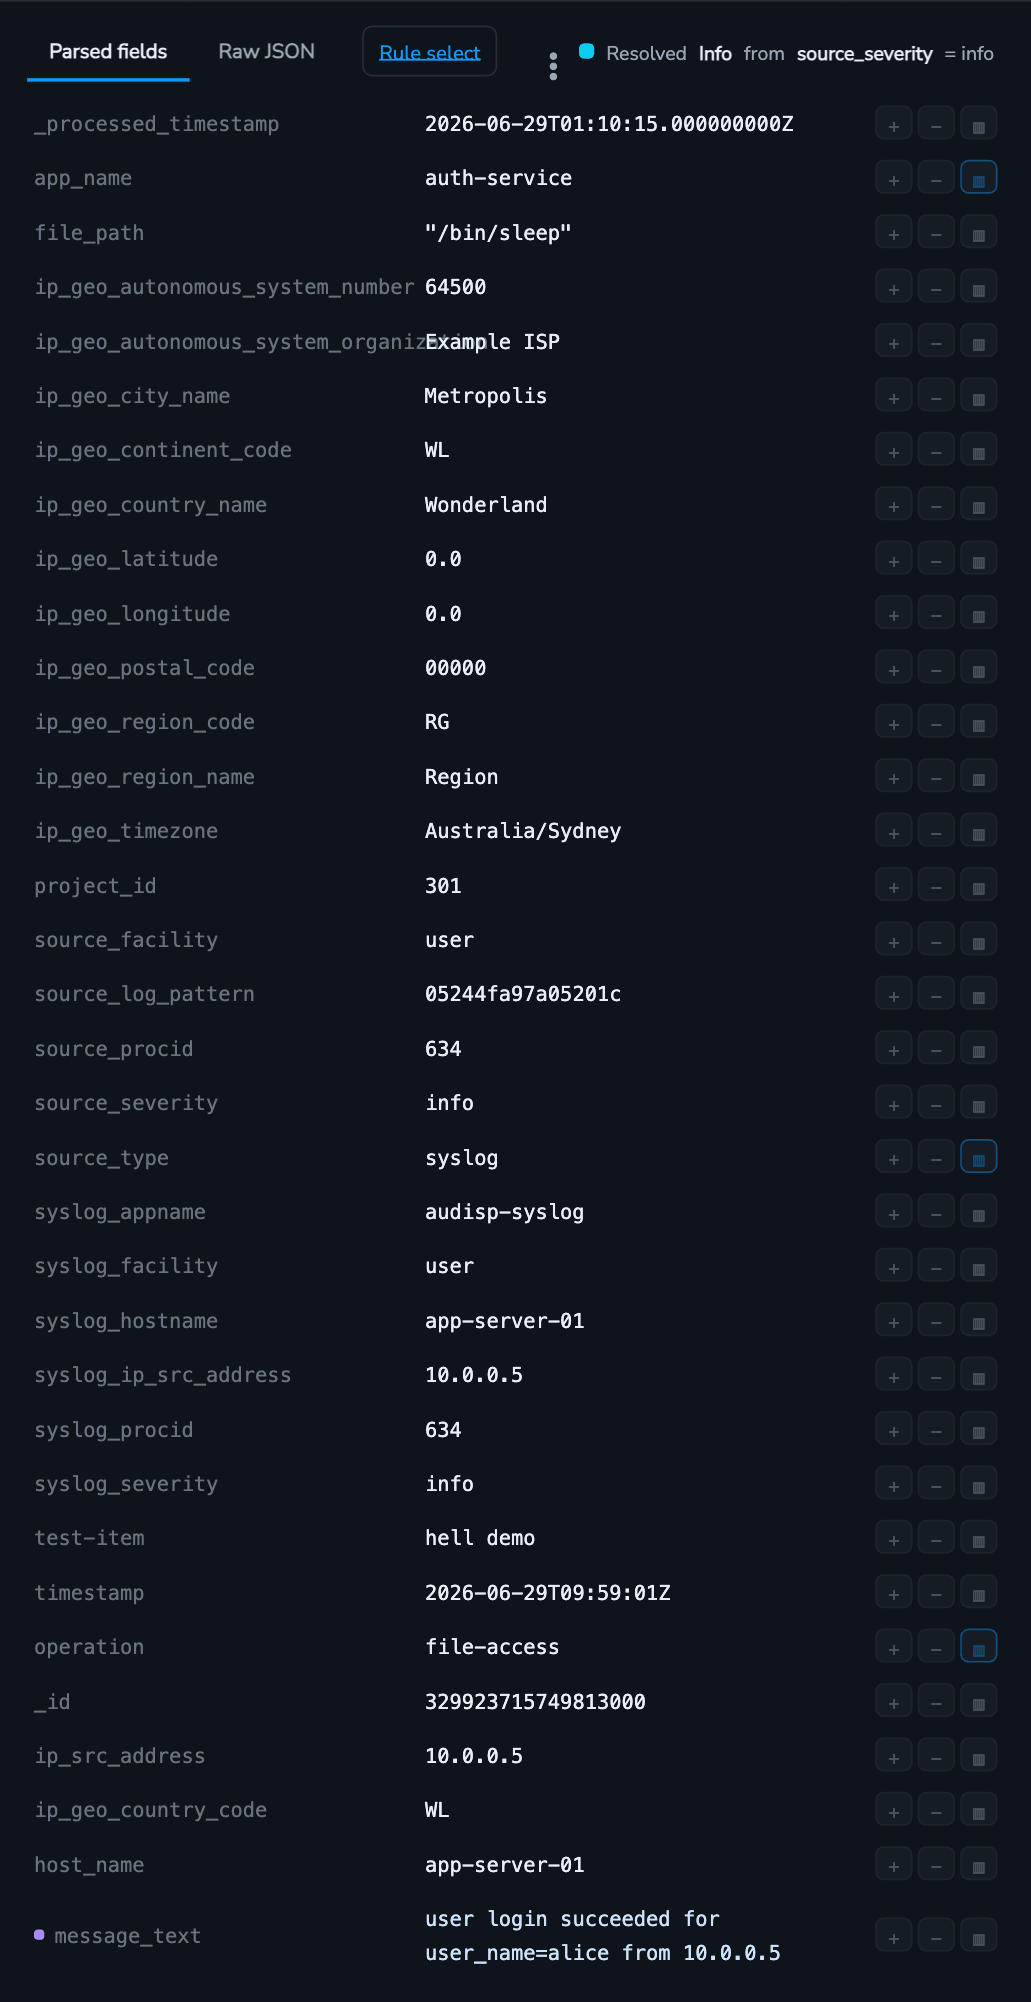
An expanded event: Parsed fields / Raw JSON tabs, the resolved severity, and per-field filter, add-column and rule actions.
From the expanded detail you can:
- Parsed fields / Raw JSON — view the event as a field table or as raw JSON.
- Filter for (+) / out (−) — on any field, add a quick filter chip and re-search. The same + and − are on the field chips of a raw row, so you can narrow without expanding the event at all.
- Add as column (▥) — promote that field to the results.
- Rule select → Create New Rule — tick the fields that matter and open the rule editor pre-filled with a condition built from them, so a one-off finding becomes a standing detection.
- Add to Threat Note — attach the event to a threat.
- Highlight any text in a field to get a popup with Filter TO, Filter NOT, Copy, and Add to Parser (to turn the selection into a log-pattern parser).
7. Filters, chips and the shareable URL
Quick filters added from the rail, a row, or a text selection appear as filter chips beneath the search bar. Remove a chip with its ✕ and the search re-runs without it.
The complete state of the page — query, filter chips, time range, type, layout, density, wrap, colour-by, and your columns — lives in the page URL. That means you can copy the link to hand an exact view to a teammate, or bookmark it. Loading the link (or a saved View) restores the workspace precisely.
8. Saved Views
Use Views to keep searches you return to often:
- Save current as new view… — captures the full context above.
- Update “
” — save changes back to the loaded View (enabled only when there are unsaved changes). - Duplicate, Delete, and a Default option.
- Filter the list to find a View by name.
9. Exporting
From the query bar’s ⋮ menu:
- Export — download the current results as CSV.
- Background Export — for large result sets, queue an export job and download it when ready.
Tips
- Start broad, then narrow. Begin with an open-search term or a single field, read the histogram and field rail, then add filter chips to zero in.
- Let colour guide triage. Leave Colour by: Auto on to spot failures and high-severity events at a glance; the rail’s source field is shown in the detail panel.
- Build views per workflow. A “rules-engine debugging” view and an “auth failures” view can each pin their own columns, colour field and meta pills.
- Turn findings into rules. When a search surfaces something worth catching every time, use Rule select → Create New Rule straight from the event.
For the full query language, see Query Syntax. For how to use all of this well — which operator to reach for, how to narrow efficiently, and the traps worth knowing about — see Search Best Practices.
 Back to top