Threat Management
Overview
A Threat is the central object in Secure60 for tracking something that needs attention — a detection from a rule, a matched threat-intelligence indicator, or a discovered vulnerability. Threat Management is the end-to-end lifecycle around that object: how threats are created from many sources, surfaced on a single overview, triaged through groups and states, responded to via email or webhook, and reported on over time.
This page ties the pieces together. The deep-dives for each piece live in their own sections — Rules, Responses, Threat Intelligence, Vulnerability Management, and Custom Tags.
1. The Threats Overview — a queue-first triage workspace
The Threats Overview is the one console for everything your team is working on. Every threat — regardless of where it came from — lands here, where it is prioritised, triaged, and tracked to closure. The page is built as a queue-first triage workspace: pick a queue on the left, work the prioritised list in the middle, and triage each threat in a slide-in drawer on the right without losing your place.
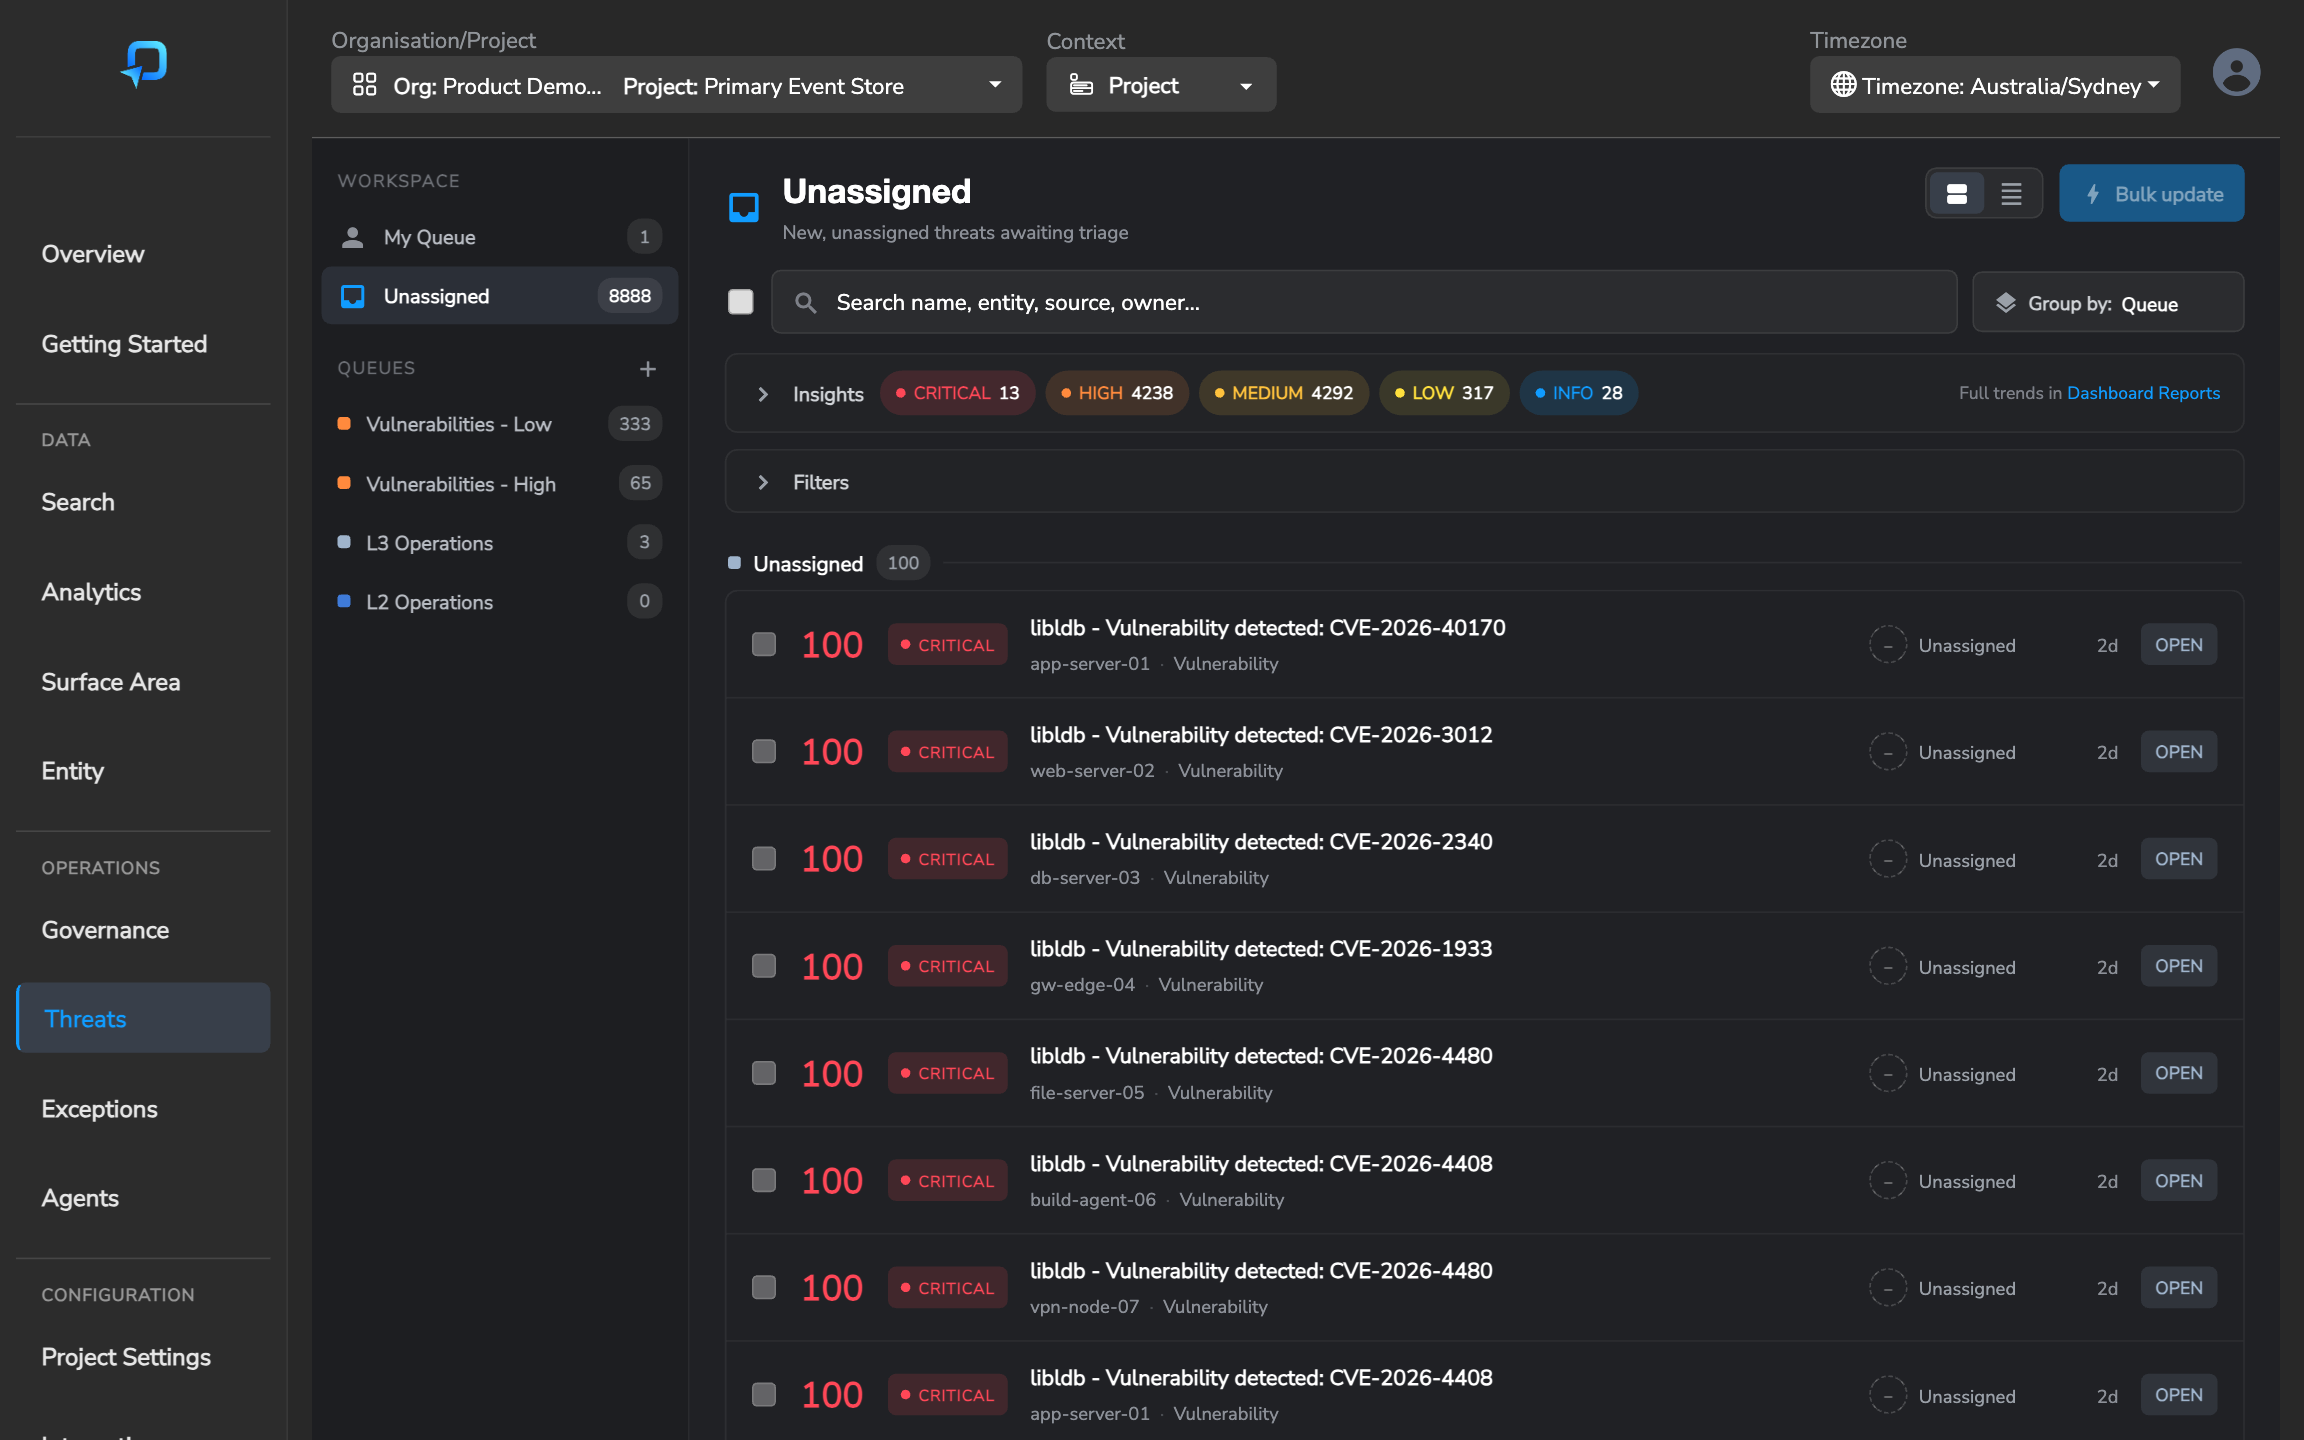
The queue-first Threats Overview: the queue rail (left) scopes the view, the Insights strip summarises the open set, and the prioritised worklist is acted on in place — selecting a row opens the triage drawer.
The queue rail — pick what to work
The left rail is how you choose what you are looking at. Selecting a row (a lens) re-scopes the whole page — header, counts, and list:
- My Queue — open threats assigned to you, highest score first. This is the default landing view for an analyst.
- Unassigned — new, unowned threats awaiting triage (the intake queue).
- Queues — one row per Threat Group, each with a colour dot and a live open-count. Use the + to create a new queue. (See §4 Threat Groups.)
Working the list
- Search & Group by — search across name, entity, source, and owner; Group by Queue, State, Source, or Severity to add sticky section headers with counts.
- Insights strip (collapsible) — severity chips (CRITICAL / HIGH / MEDIUM / LOW / INFO) for the open set; click a chip to filter. A Threat Timeline with a Trends / By Group toggle shows volume over time. A link jumps to full Dashboard Reports.
- Filters (collapsible) — narrow by Source (including Exclude options, e.g. hide vulnerabilities), Entity Group, Entity / Host, and Time Period.
- The worklist — threats are ranked by severity (CRITICAL first) so the most urgent surface on page one. Each row shows score · severity · name · entity · source · owner · age · state, with an indicator when a threat carries analysis notes. A density toggle switches between a richer Comfortable row and a dense Compact row, and the list loads more as you scroll.
- Bulk update — tick multiple threats and use Bulk Update to set state, assign an owner or queue, add a note, or close them together.
The triage drawer — act without leaving the queue
Selecting any row opens a detail drawer beside the list (the queue stays visible and interactive). The drawer is built for fast, in-place triage:
- Header & meta — score, severity, threat ID and name; Entity, Source, Queue, and Created.
- Analysis & Context — a running record of notes attributed to whoever (or whatever) wrote them. Human analysts add context inline; where you run Digital Workers, an AI analyst’s findings appear here too, attributed to the worker. Long notes are truncated with a show more.
- Triage actions — change State, Owner, or Queue; Assign to me in one click; or Close (which requires an Outcome — see §5).
- Activity timeline — detection, auto-scoring, notes, and every owner/state change, so the threat documents itself.
- Open full investigation — jump to the full Threat Detail page for the deep dive (entities, related events, full timeline, and — for AI-raised threats — a View Agent Session link to the exact worker run that raised it).
The triage drawer (illustrative). Triage state, owner, queue, context and closure all happen here — the queue stays open beside it.
2. Types of Threats — where they come from
Threats are deliberately source-agnostic: the value of the overview is that detections, intel matches, and vulnerabilities sit side by side in one queue. Each threat carries a source label so you can still slice by origin.
Rules are the primary engine. A rule queries your data and, when its conditions match, runs a create_threat action that raises a threat (with a score, severity, and optional source field). Rules range from simple thresholds to correlation and behavioural analytics, and Secure60 ships Managed Rules maintained by our team. See Rules and Rule Groups for how rules are built, deployed to projects, and how create_threat works (including the Check by Rule, Entity, Source de-duplication option).
Threat Intelligence matches indicators of compromise (IOCs) against your ingested data and raises threats on a hit. See Threat Intelligence.
Vulnerability Management scans a software inventory (SBOM) for known CVEs and automatically raises threats with the source label Vulnerability — including auto-closure when a CVE is no longer detected. See Vulnerability Management.
Because rules are what turn data into threats, the fastest way to add new detection coverage is to create or enable a rule. Start with high-fidelity Managed Rules, then layer custom rules for your environment.
3. Responses — taking action on threats
A Response is how the platform reaches out to the world when threats are raised. Responses are objects triggered by rules, and there are two action types:
- Email — notify a user or group. Supports real-time (one email per threat) or digest (a single grouped, scheduled email) delivery.
- Webhook — an HTTP request to any endpoint: Slack, a firewall API to block an IP, a directory API to disable a user, or a ticketing/SOAR platform.
Responses can be generic (fire on any threat) or focused. Two controls plus overrides decide exactly when a response fires:
- Scope —
ALL,SIGNAL, orTHREAT. - Severity — only fire at or above a chosen severity (
INFO/LOW/MEDIUM/HIGH). - Overrides — fine-tune by rule group or source type, e.g. “alert the Linux Admins when a rule in the Linux group fires”, or “fire on every threat except a specific rule group”. Overrides can also span a whole hierarchy of sub-organisations.
Response content supports templating ({{threat_id}}, {{name}}, entity fields, deep links into the Portal), so emails and webhook payloads carry the specific context of the threat that triggered them.
Full detail — delivery modes, the digest schedule, override examples, and templating syntax — is in Responses.
4. Threat Groups — recommended way to organise work
A Threat Group is a label that places a threat into a queue so the right people work the right threats. Groups are how most teams operate the overview day-to-day — for example L1 Support, L2 Support, Patching, or per-team / per-business-unit queues.
Recommendation: set up a small number of threat groups that mirror how your team divides work, then triage by routing each threat into a group. The overview’s By Entity Group and group-based trend charts make backlog per queue visible at a glance.
Threat Groups are defined as Custom Tags (threat_group) under Organisation Settings → Custom Tags; each value you add becomes a selectable option in the threat dropdowns and reports. See Custom Tags.
Get notified about a group
Individual users can subscribe to the groups they care about so they are emailed when work lands or changes. Subscriptions are per-user, configured in Organisation Settings → Users → (edit user) → Threat Group Notifications:
- Notify on assignment — email when a threat is assigned to that group.
- Notify on change — email when a threat already in that group changes state or is updated.
See User Management → Threat Group Notifications.
5. Threat States & Outcomes — track work your way
Secure60 does not force a fixed workflow on you. Two configurable fields let you model the lifecycle your team follows:
- Threat State — the stage a threat is at in its resolution (its progress). You define the stages, for example NEW → IN PROGRESS → ON HOLD → CLOSED. The final state is always Closed.
- Threat Outcome — what the threat turned out to be once worked. For example MALICIOUS, BENIGN, FALSE POSITIVE, or REMEDIATED. Outcomes let you report on the quality of detections, not just the count.
Both are defined as Custom Tags (threat_state and threat_outcome) under Organisation Settings → Custom Tags — each value you add appears in the threat dropdowns and in reports. You can also configure automatic threat notes and notifications that fire on a state change, so the timeline documents itself. See Custom Tags.
6. Reporting & Schedules — track status over time
Beyond the live overview, Secure60’s Dashboard Reports let you build saved views of threat status — counts by group, severity, source, outcome, and trends over time — using charts, KPI tiles, and tables. Reports are configured in the Portal (with a visual builder and JSON editor) and can be scheduled to render and deliver automatically (for example a weekly PDF to stakeholders).
Typical threat-management reports:
- Open threats by group — backlog per queue (L1 / L2 / Patching).
- Burndown / trend — open threats over time, to show whether you are keeping pace.
- Outcomes breakdown — malicious vs benign vs false-positive, to measure detection quality.
- Severity & source mix — where your risk and noise are concentrated.
See Reports for chart types and configuration, and Export for bulk data extraction.
Putting it together — a typical workflow
- Detect — rules, threat intelligence, and vulnerability scans raise threats from many sources.
- Surface — every threat lands on the Threats Overview, labelled by source and severity.
- Route — assign threats to Threat Groups so the right team picks them up; subscribers are notified.
- Work — move threats through your States, add notes, and let Responses drive email/webhook actions.
- Resolve — close with an Outcome (malicious, benign, false positive, remediated…); vulnerability threats can auto-close.
- Report — track backlog, trends, and outcomes with scheduled Dashboard Reports.
Need Help?
For help designing your threat groups, states, and reporting, contact our team at support@secure60.io.
 Back to top