Firewall and Network Device - Integration Guide
This guide shows you how to bring firewall, router, switch, and other network-device logs into Secure60 over syslog, and how to normalise each vendor’s format so that searches and detection rules can rely on the fields.
Overview
Network devices almost all speak syslog, and almost all speak it differently. Palo Alto sends comma-separated values, FortiGate sends key=value pairs, Cisco sends prose, and Check Point sends whichever format its Log Exporter is configured for. Normalising those formats onto one shared schema is what makes a query for ip_src_address=203.0.113.10 return the firewall session, the web request, and the VPN login together.
The integration has three parts:
- Deliver — point the device’s syslog output at a Secure60 Collector
- Identify — make sure each device’s events carry a stable name you can match on
- Normalise — deploy the parser for that device, which extracts the vendor’s fields into the Common Information Model

Prerequisites
- A deployed Secure60 Collector with network reachability from your devices — the collector is usually placed close to the network estate rather than in a cloud subnet
- Syslog egress permitted from the management interface of each device to the collector
Step 1: Choose a collector port
The collector listens on several ports, and the right one depends on what the device emits.
| Port | Protocol | Use it for |
|---|---|---|
514 |
UDP | Standard syslog. The default for almost every network device. |
6514 |
TCP + TLS | Syslog where the path crosses an untrusted network, or where the device supports TLS |
1514 |
UDP | Raw syslog, for vendors whose output is not RFC5424-conformant — see the Check Point note below |
5044 |
TCP | Logstash / Beats protocol, when a shipper sits between the device and the collector |
Publish the ports you need when you start the collector:
docker run -i --name s60-collector \
  -p 80:80 -p 443:443 -p 514:514/udp -p 6514:6514 -p 1514:1514/udp -p 5044:5044 \
  --rm -d --env-file .env secure60/s60-collector:stable
Check Point, and any device whose message starts with [
RFC5424 reserves the position immediately after the syslog header for structured data, written as [id key="value"]. Some vendors — Check Point Log Exporter is the common one — put their own payload there instead. A conformant syslog parser reads that payload as structured data and truncates it at the first ], which silently discards most of the log line.
Send those devices to port 1514 instead of 514. That listener takes the bytes untouched, splits the header itself, and keeps the payload whole in message_text. Conformant senders are unaffected either way, so when in doubt, send a sample and check the field is complete in Search.
Step 2: Configure the device
Configuration differs by vendor. The settings below cover the most common estates; the pattern is the same for anything not listed.
Palo Alto Networks (PAN-OS)
- Device → Server Profiles → Syslog → Add. Name the profile
secure60, add a server entry with the collector address, transportUDP, port514, and formatBSD. - Device → Log Settings — attach the profile to the System, Configuration, and User-ID log types.
- Objects → Log Forwarding → Add — create a profile that forwards Traffic, Threat, and URL Filtering logs to
secure60. - Policies → Security — set that log-forwarding profile on the rules you want visibility over, and ensure Log at Session End is enabled.
Fortinet FortiGate
config log syslogd setting
    set status enable
    set server "<S60_COLLECTOR_IP_ADDRESS>"
    set port 514
    set mode udp
    set format default
end

config log syslogd filter
    set severity information
    set forward-traffic enable
    set local-traffic disable
end
set format default produces FortiGate’s native key=value output, which is the easiest of its formats to parse reliably.
Cisco ASA
logging enable
logging timestamp
logging trap informational
logging host <INTERFACE_NAME> <S60_COLLECTOR_IP_ADDRESS>
Cisco IOS and IOS-XE
service timestamps log datetime msec localtime show-timezone
logging host <S60_COLLECTOR_IP_ADDRESS> transport udp port 514
logging trap informational
logging source-interface <INTERFACE_NAME>
Access-list hits are only logged when the ACL entry carries the log or log-input keyword.
Check Point
cp_log_export add name secure60 target-server <S60_COLLECTOR_IP_ADDRESS> \
  target-port 1514 protocol udp format syslog
Note the port — see the callout in Step 1.
Juniper SRX
set system syslog host <S60_COLLECTOR_IP_ADDRESS> any notice
set security log mode stream
set security log format syslog
set security log source-address <DEVICE_IP_ADDRESS>
set security log stream secure60 host <S60_COLLECTOR_IP_ADDRESS> port 514
pfSense and OPNsense
Status → System Logs → Settings → Remote Logging: enable remote logging, set the collector as <S60_COLLECTOR_IP_ADDRESS>:514, and select the log types to forward — Firewall Events at minimum.
Other vendors
MikroTik, Ubiquiti, Sophos, SonicWall, Meraki, F5, and Netgate devices all follow the same shape: a syslog server address, a port, a severity, and a selection of log categories. Point them at the collector and continue to Step 3.
Step 3: Give each device stream a name
Parsing depends on being able to say which events a rule applies to. Syslog gives you two identifiers for free:
host_name— taken from the syslog header, so it is whatever the device calls itselfapp_name— taken from the syslog tag or program name
Where a device does not set a useful tag, a parser can add fixed fields — a source name, a site, a business unit — to everything matching that device.
A dedicated collector per device class — one for the perimeter firewalls, one for campus switching — keeps this simple and keeps a noisy device from affecting anything else. Collector Groups organise collectors for that purpose: see Collectors.
Step 4: Deploy the parser
Once the device’s logs are arriving, deploy the appropriate parser to fully normalise the events. Parsers are managed in the portal under Integrations → Secure60 Collector → Log Parsers, assigned to a Collector Profile, and the profile is assigned to your Collector Group — the collector picks the configuration up automatically, with no redeployment.
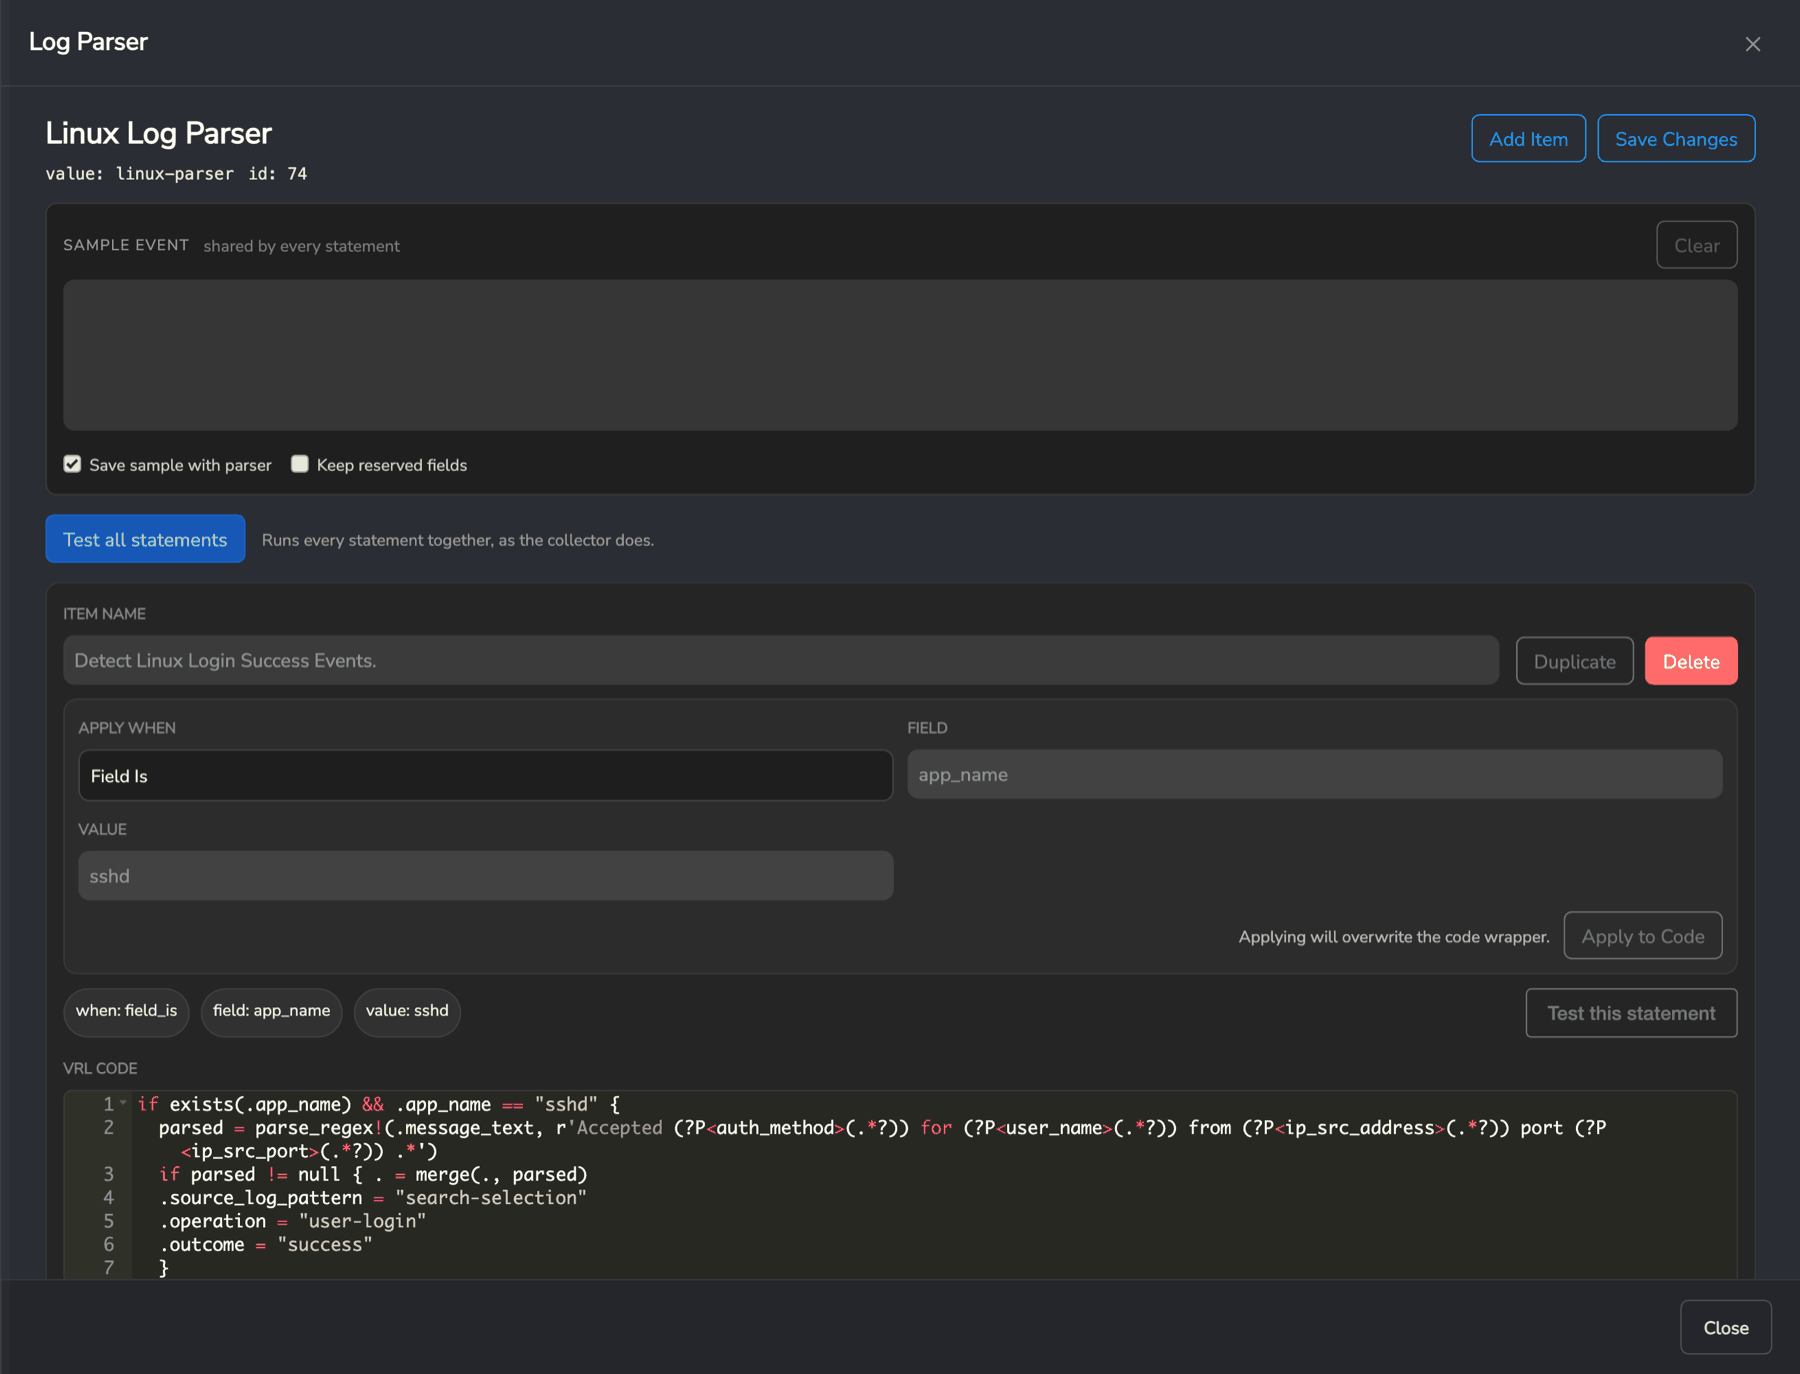
Each parser statement carries a condition — typically Field Is on app_name or host_name, so it only touches that device’s events — and the logic that extracts the vendor’s fields. The Sample Event box takes a captured log line and Test this statement shows the fields it produced, so a parser can be verified before it is saved.
Talk to our integrations team at integrations@secure60.io about the right parser for your devices — we maintain parsers for the common vendors and can build one for a format you have on site.
Let the platform find the pattern for you
Integrations → Secure60 Collector → Log Patterns groups incoming logs into recurring structures with the variable parts marked as <*>. Selecting and naming those parts builds a parser from real traffic, which on an unfamiliar vendor format is faster than starting from the vendor’s documentation. See Collectors.
Step 5: Verify the data
Open Search and query for the events you have enabled:
operation=firewall
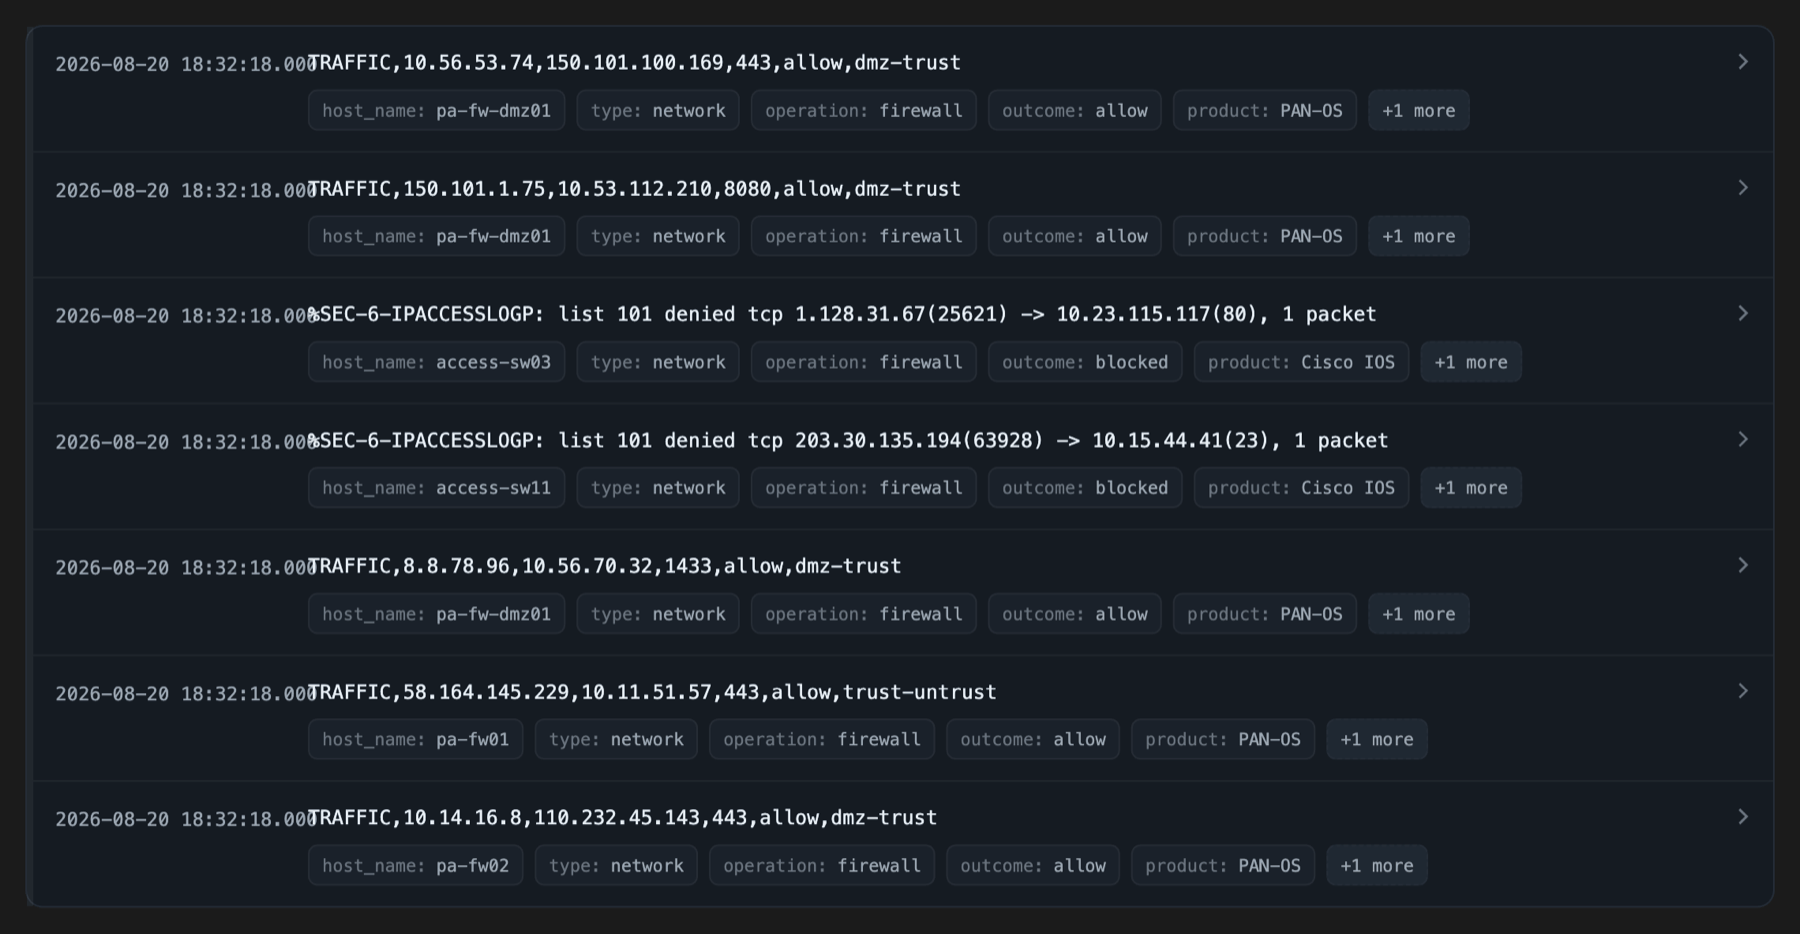
The Palo Alto traffic log and the Cisco access-list hit arrive in the same shape — type: network, operation: firewall, with an outcome and an addressable source and destination — despite starting as two unrelated text formats.
Managing volume
Firewall traffic logs are usually the highest-volume source in an estate, and ingest volume is the main cost lever on the platform. Filter at the device, where the decision is cheapest:
- Log session end rather than session start, so each connection is one event instead of two
- Turn off logging for intra-zone and local traffic you will never investigate (
set local-traffic disableon FortiGate is a good example) - Log allowed traffic selectively — denies, administrative access, and internet-facing rules earn their place; internal chatter between two trusted subnets usually does not
Where the device cannot filter finely enough, the collector can drop events on a content match — see Implement Data Masking. Treat that as a fallback; an event dropped at the collector has already cost bandwidth to deliver.
For traffic volumes and conversation-level analysis, flow data is far cheaper than per-connection logs — see the Secure60 Netflow Processor.
Related
- VPN - Integration Guide — remote-access logins from the same devices
- Web Application Firewall (WAF) - Integration Guide — application-layer blocking
- Nginx - Integration Guide — correlate what the firewall allowed with what the web server served
- Secure60 Netflow Processor — NetFlow and sFlow ingestion
- External Integrations — the full picture of supported sources
- ISO 27001 A.8.16 Monitoring Activities — network monitoring evidence
 Back to top