Execution Activity
Detection Rules tells you what your rules are. Execution Activity tells you what they have actually been doing — which ran, how often, how much each one produced, and what happened to the work they created.
Two tabs sit beside the rule library, both scoped to the focused project rather than to whichever rule group is open in the sidebar. “Which rule group is flooding me” is a question across groups, so the tabs answer it in one view instead of asking you to click through packs.
Rule Execution
Every time a polling rule is evaluated, the platform records the run: whether it matched, how many rows it matched, how long it took, and how far behind schedule it was when it started.
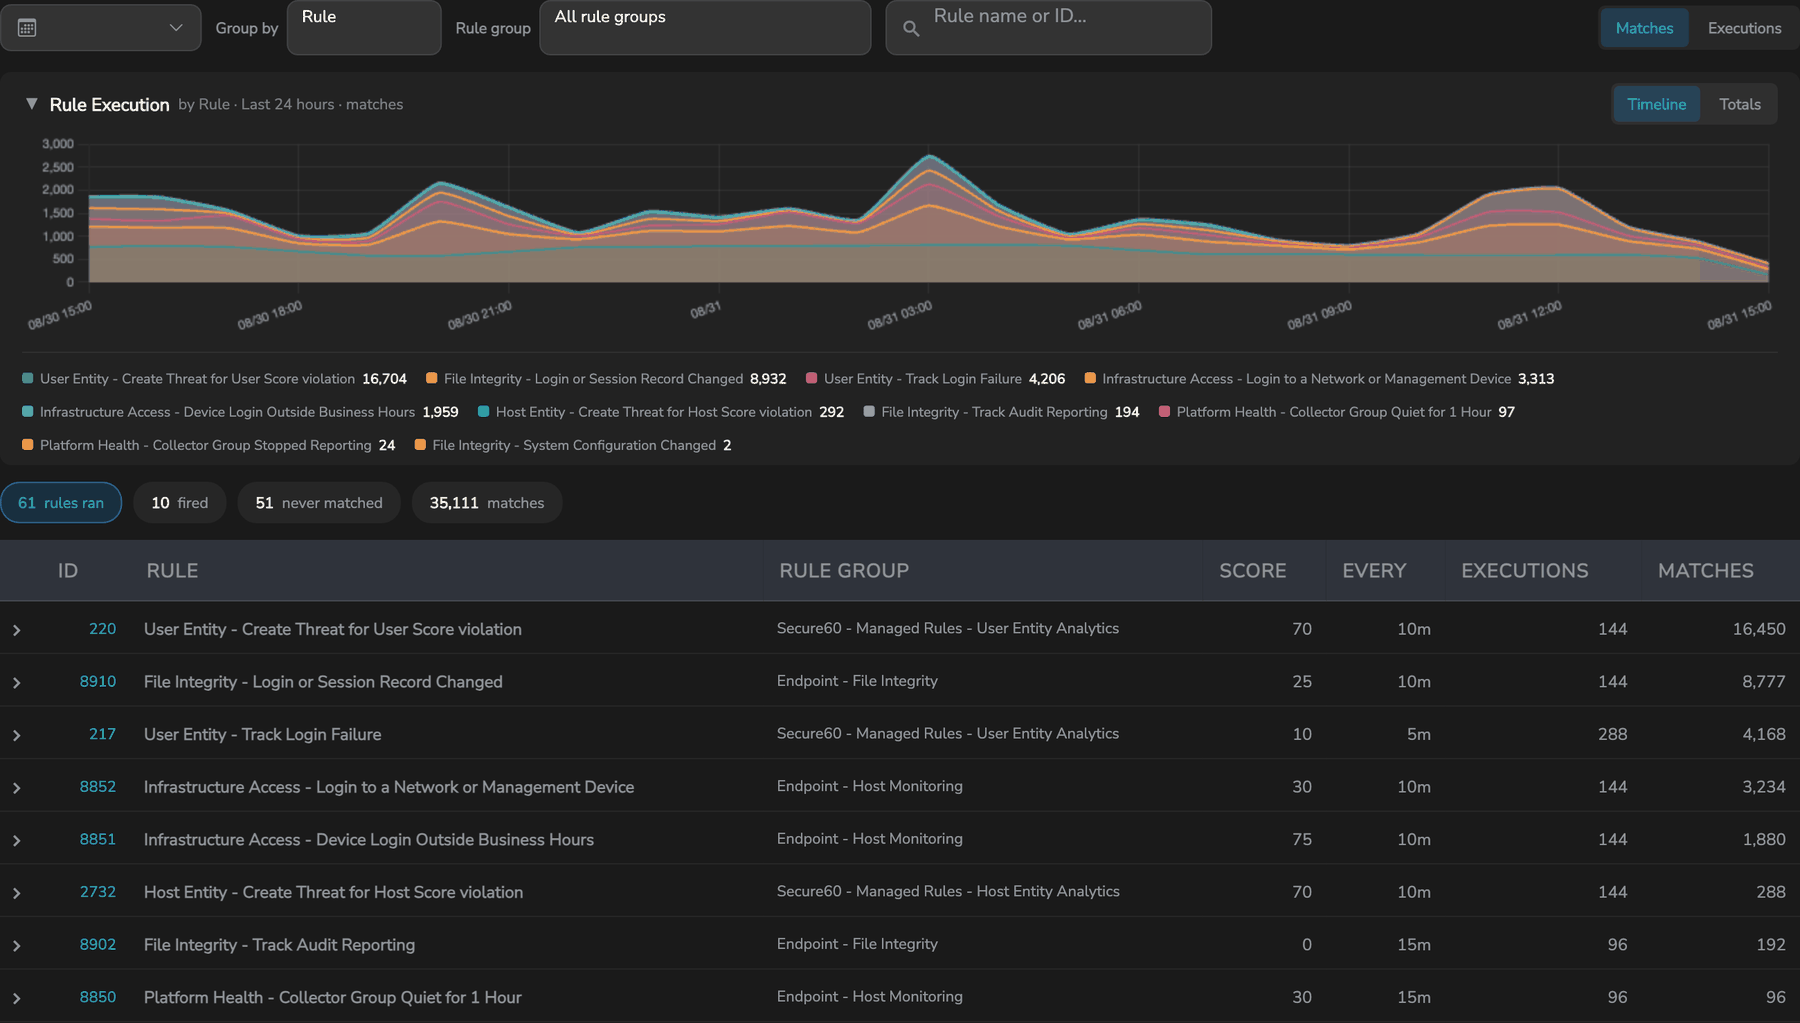
Executions and matches are different numbers
This is the distinction the whole tab turns on.
- Executions — how many times the rule was evaluated. Driven almost entirely by its frequency: a rule on a 5-minute schedule is evaluated 288 times a day whether it matched twice or five thousand times.
- Matches — how many rows those evaluations produced. This is the work the rule created: the threats, signals and entity updates that followed.
Ranking by executions tells you which rules run most. Ranking by matches tells you which rules are loudest, and that is almost always the question behind “why am I getting so many threats”. The Matches / Executions toggle at the right of the filter bar switches what the chart counts; the list always shows both, side by side, so the two can never disagree.
A rule with 288 executions and 4 matches is working exactly as intended. A rule with 144 executions and 16,000 matches is the one to look at.
Reading the summary chips
The chips beneath the chart are both a summary and a filter — select one to narrow the list.
| Chip | What it counts |
|---|---|
| rules ran | Rules evaluated at least once in the window |
| fired | Rules that matched at least once |
| never matched | Rules that ran across the whole window without ever matching |
| matches | Total rows produced |
| failed runs | Evaluations that ended in an error |
Never matched is worth a regular look. A rule that has not matched in thirty days is either watching for something genuinely rare, or watching for something that no longer arrives — a renamed field, a log source that stopped reporting, a query that no longer fits the data. Both are worth knowing; only one is a problem.
Grouping the chart
Group by re-pivots the chart without changing the list. Every option is a field recorded on the run itself, so grouping is immediate:
- Rule — the loudest individual rules
- Rule group — which pack is producing the volume
- Score — whether the volume is coming from high-value detections or low-score noise
- Outcome — successes against failures
- MITRE Tactic — coverage and firing rate together
Looking at individual runs
Selecting a rule expands its most recent runs — the time, whether it matched, how many rows, how long it took, and how long it waited in the queue before starting. Selecting a run opens the complete record behind it.
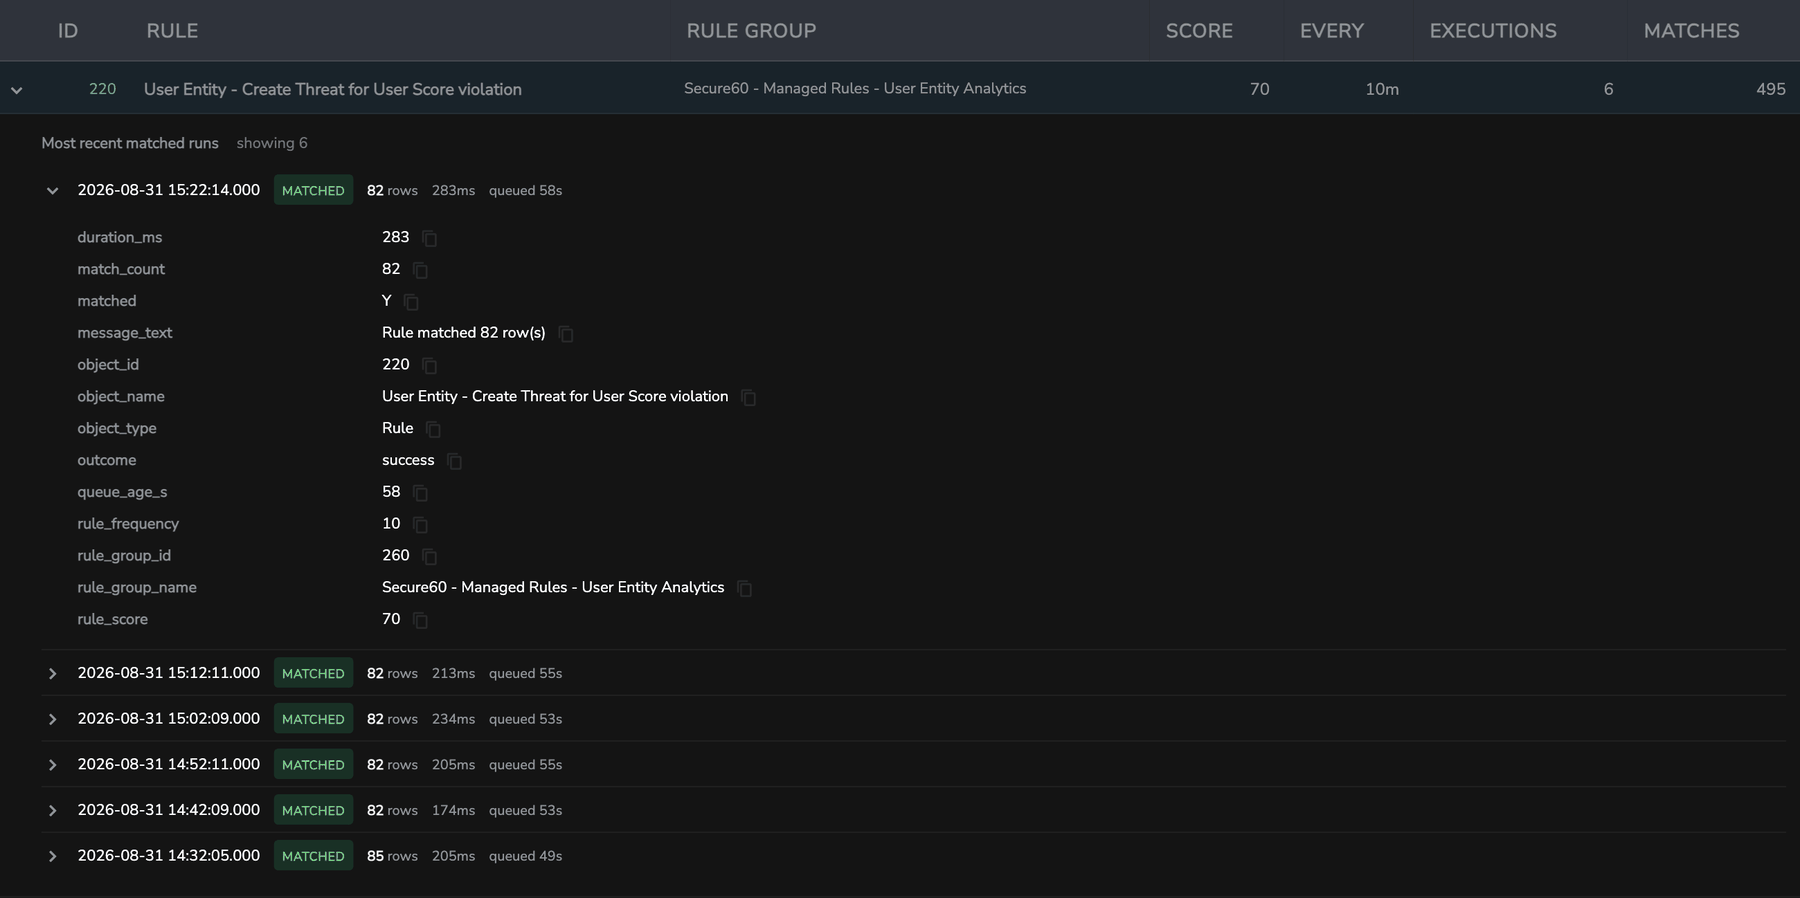
Every field can be copied individually with the icon beside it. object_id is the rule’s ID — the same value that appears in a threat, a queue entry or a support request.
Queue age is the field people miss. It measures how long the run waited before the engine picked it up, which is a different question to “what is firing”. A rule that consistently starts a minute late is telling you about engine load, not about your data.
Finding a rule
The search box matches on rule name or rule ID — enter a number and it finds that rule whether the digits appear in its name or not. The Rule group dropdown narrows to one pack, and the two combine.
Rule IDs in the list are links. Selecting one opens that rule in the library with its group already selected; open it in a new tab in the usual way if you would rather keep the activity view where it is. The link carries the rule in the address, so it can be pasted into a ticket or a chat message and will take someone straight to the same rule.
Only polling rules are recorded
Streaming rules are evaluated as data arrives rather than on a schedule, and do not produce execution records. They will not appear on this tab. See Rule Execution on the Rules page for the difference between the two.
Response Execution
The second tab follows what happened after a rule matched, and has two views.
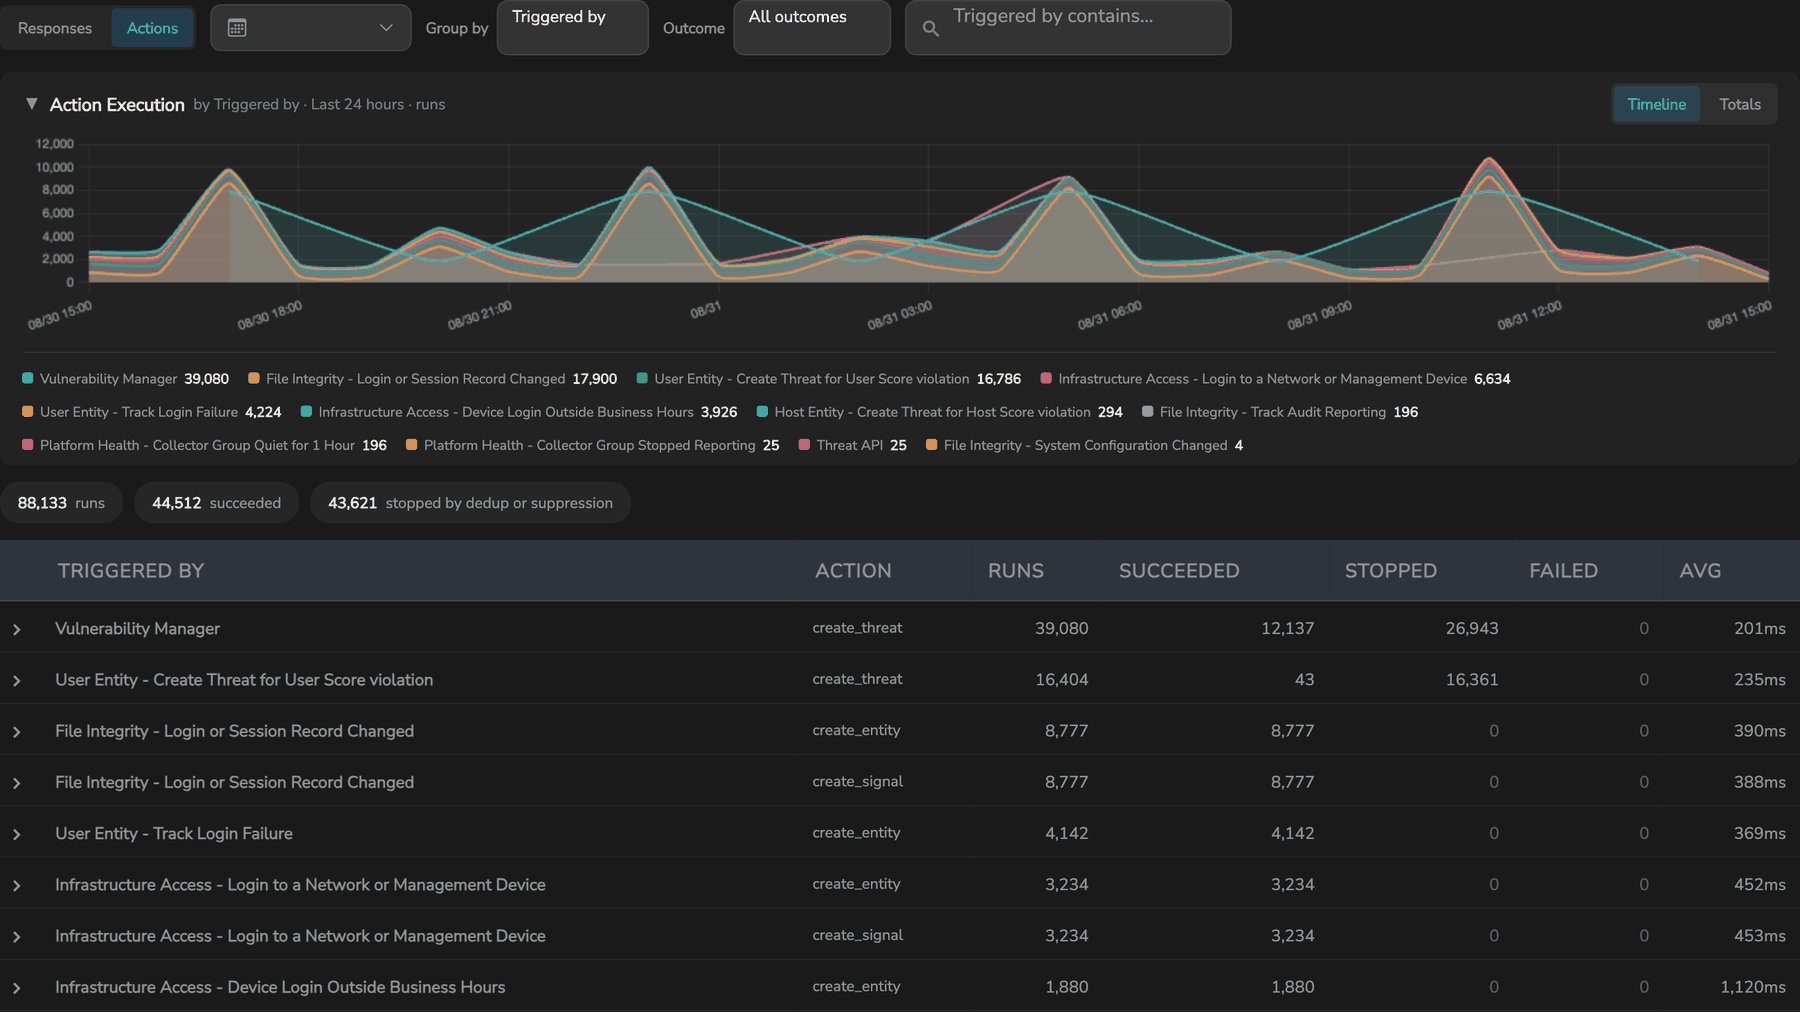
Actions are the work the engine queued off a match — creating a threat, a signal or an entity. Responses are the outward steps that followed, such as an email or a webhook. They are two grains of the same chain, so they share a tab and a switch rather than being separated.
Runs is not the same as succeeded
Runs counts every attempt, whatever the result. Succeeded counts the ones that completed. The gap between them is the interesting part, and the outcomes differ between the two views:
| View | Outcomes recorded |
|---|---|
| Actions | Succeeded, Stopped, Failed |
| Responses | Succeeded, Partial, Failed |
Stopped means the action was deduplicated or suppressed before anything was created — the rule matched, but the threat already existed, so no duplicate was raised. This is the platform doing its job, and on a busy project it is often a large share of all action volume. Seeing it plainly is useful in two ways: it explains why a rule with thousands of matches produced only a handful of threats, and a rule whose actions are almost entirely stopped is a rule matching far more broadly than it needs to.
Partial applies only to Responses, and means some operations in the Response were delivered while others failed — one of three email recipients bouncing, for example.
Following the chain
Expanding a row shows individual records. Where a record created something, it carries the identifier: a Response records the threat it acted on, and a create_threat action records the threat it produced. That is the chain end to end — rule ran, action queued, threat created, response sent.
Group the chart by Triggered by to see which rules are driving the work, and note that not every action comes from a rule: the Vulnerability Manager, Threat Intelligence and the AI agents all queue actions too, and each appears by name.
Choosing a time range
Both tabs default to the last 60 minutes, which is the right window for “what did the change I just made do”. The range control offers longer relative windows, the standard rolling periods, and an explicit from / to with times — the last of these is what you want when tracing a specific incident rather than watching current behaviour.
Execution records are kept for twelve months by default, considerably longer than raw event retention, so these tabs can answer questions about last quarter that a log search no longer can.
What this replaces
Before this view, the honest answer to “is this rule doing anything” was to infer it from the threats it had produced. That works only for rules that create threats, only while those threats still exist, and never tells you about a rule that ran ten thousand times and matched nothing. Execution Activity answers it directly.
 Back to top