Web Application Firewall (WAF) - Integration Guide
This guide shows you how to bring Web Application Firewall events into Secure60 and how to correlate what the WAF blocked with what your web servers served.
Overview
A WAF log on its own records what the WAF stopped. Three questions need a second source to answer: whether anything from that address got through, whether the scan blocked at /admin succeeded on another path, and whether the credential-stuffing run moved to an endpoint no rule covers.
Answering them requires WAF events and web server events to share a schema, so this guide pairs with the Nginx - Integration Guide.
Delivery paths
WAFs fall into three groups by how they emit logs.
| WAF | Path into Secure60 |
|---|---|
| F5 BIG-IP ASM / Advanced WAF, Imperva, Barracuda, Fortinet FortiWeb | Syslog to the collector, usually in CEF |
| ModSecurity / Coraza (with Nginx or Apache) | JSON audit log, forwarded from the host |
| AWS WAF | Kinesis Data Firehose → S3 → Integrate S3 |
| Cloudflare | Logpush to object storage, or to an HTTP endpoint on the collector |
| Azure Application Gateway / Front Door WAF | Diagnostic settings → Configure Azure Cloud |
| Palo Alto, FortiGate inline threat logs | Already covered by the Firewall and Network Device guide |

Prerequisites
- A deployed Secure60 Collector
- For appliance WAFs: syslog egress to the collector on
514/udpor6514/tcp(TLS) - For cloud WAFs: the relevant cloud integration configured — S3 or Azure
Appliance WAFs over syslog
Send CEF where you can
F5 ASM, Imperva, and FortiWeb can all emit Common Event Format, and it is the format to choose. CEF carries the rule name, severity, attack type, and request context as named fields, which makes it the most reliable input to normalise from.
F5 BIG-IP ASM — under Security → Event Logs → Logging Profiles, create or edit a profile, enable Application Security, set the destination to a remote syslog server with your collector address, and select the CEF storage format. Attach the logging profile to the virtual server.
Imperva SecureSphere — under Policies → Action Sets, add a syslog action using the CEF template and attach it to the security policies you want reported.
Where CEF is not available
Send the vendor’s native format. Whichever format arrives, deploy the parser for that product to fully normalise the events — see Deploy the parser below.
ModSecurity and Coraza
ModSecurity’s JSON audit log needs no regular expressions at either end.
SecAuditEngine RelevantOnly
SecAuditLogFormat JSON
SecAuditLogType Serial
SecAuditLog /var/log/modsec_audit.log
SecAuditLogParts ABIJDEFHZ
Forward the file with rsyslog:
module(load="imfile")

input(type="imfile"
      File="/var/log/modsec_audit.log"
      Tag="modsec"
      Severity="warning"
      Facility="local7")

*.* @@<S60_COLLECTOR_IP_ADDRESS>:6514
The audit records arrive as JSON in message_text, ready for the parser to expand into fields.
Cloud WAFs
AWS WAF — enable logging on the Web ACL to a Kinesis Data Firehose delivery stream with an S3 destination, then follow Integrate S3 to collect the objects. AWS WAF writes newline-delimited JSON, one record per evaluated request.
Cloudflare — configure a Logpush job for the http_requests dataset. Push to object storage and collect it as above, or push to an HTTPS endpoint on the collector, which accepts JSON on port 443:
curl -X POST -H "Content-Type: application/json" \
  --data @sample.json https://<S60_COLLECTOR_IP_ADDRESS>/
Azure Application Gateway and Front Door — send the ApplicationGatewayFirewallLog category to a diagnostic destination and collect it with the Azure integration.
Deploy the parser
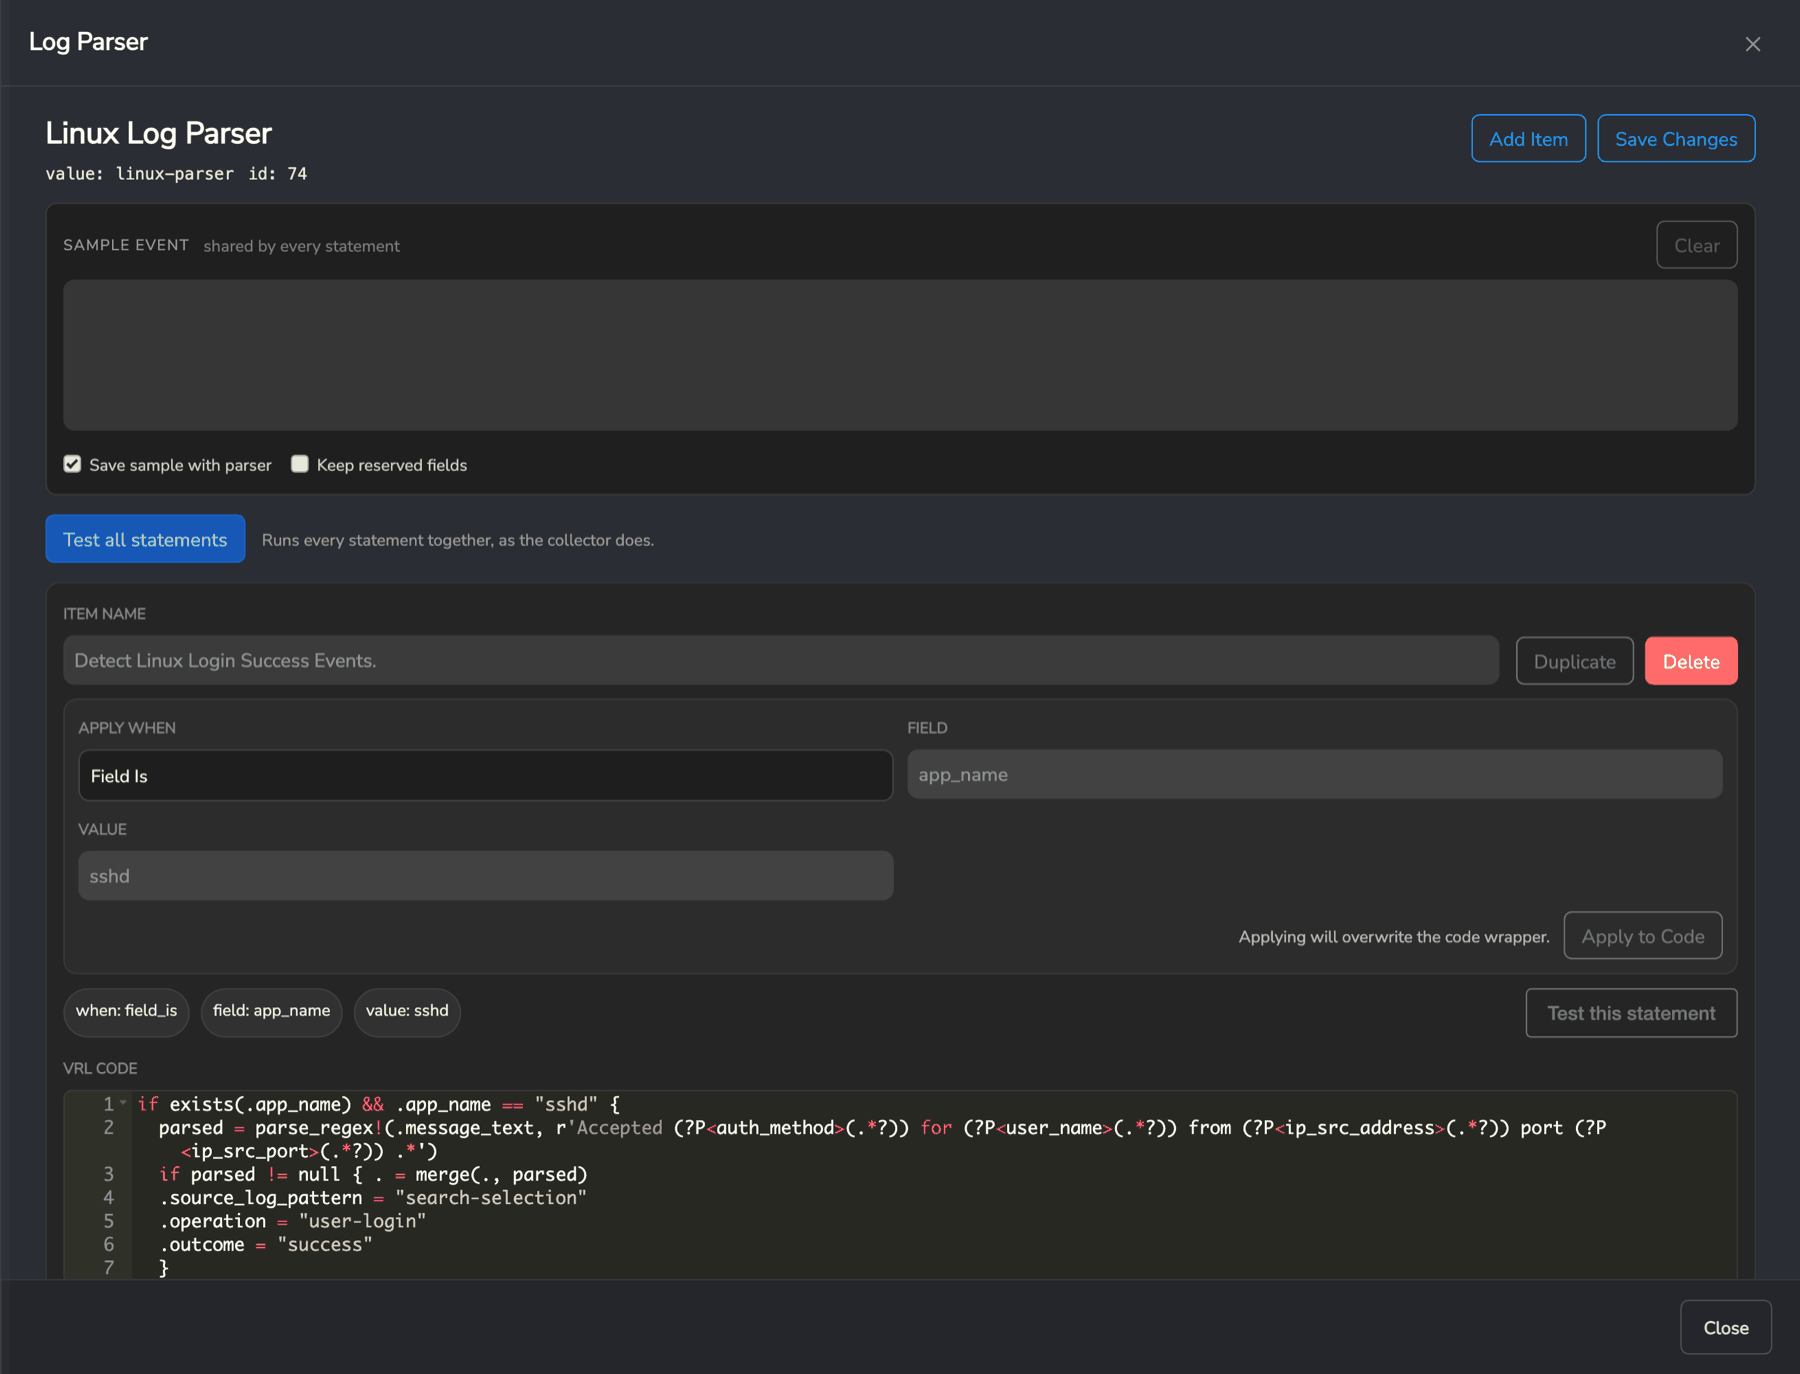
Whatever the source, deploy the appropriate parser so WAF events land on the same fields as the rest of your data — the same ip_src_address, http_uri, and http_status_code your web server events use, which is what makes the two correlate on a single query.
Parsers are managed in the portal under Integrations → Secure60 Collector → Log Parsers, assigned to a Collector Profile, and the profile is assigned to your Collector Group. The collector picks up the configuration automatically, with no redeployment.
Talk to our integrations team at integrations@secure60.io about the right parser for your WAF.
Verify and use the data
Open Search and confirm the events are arriving and normalised:
type=alert AND operation=firewall
The queries that make the integration worth having are the ones that span sources:
| Query | What it tells you |
|---|---|
alert_type:"SQL Injection" |
Every injection attempt the WAF recognised |
ip_src_address=203.0.113.10 |
Everything one source did — WAF blocks, web requests served, VPN logins |
product=nginx AND http_status_code=200 AND ip_src_address=<blocked source> |
Requests from a source your WAF blocked elsewhere that still reached the application |
outcome=blocked |
The full block stream, for tuning false positives |
A source the WAF is blocking that is also receiving 200s from the origin indicates a rule gap, or a path that bypasses the WAF. See Create Rules for turning that into a detection.
Managing volume
A WAF in front of a public site sees every request, and full request logging — headers, bodies, matched data — multiplies the size of each event. Log blocked and alerted requests in full, and allowed traffic in summary. Where the appliance cannot make that distinction, drop the noise at the collector with Drop Events Containing, and remove oversized fields with Remove Fields by Name: see Implement Data Masking.
That guide also matters for a second reason. WAF events often capture the offending request payload, which can include credentials, tokens, and personal data from legitimate users caught by a rule. Redact those fields at the collector, before they leave your environment.
Related
- Nginx - Integration Guide — the origin logs that make WAF events answerable
- Firewall and Network Device - Integration Guide — syslog delivery and vendor parsing in detail
- Integrate S3 — for AWS WAF and Cloudflare Logpush
- Configure Azure Cloud — for Application Gateway and Front Door
- Implement Data Masking — redact captured request payloads
- PCI DSS Requirement 11.3 — WAF events as detection evidence
 Back to top