Nginx - Integration Guide
This guide shows you how to send Nginx access and error logs to Secure60, normalised into the Common Information Model so that web activity is searchable, chartable, and usable in detection rules from the first event.
Overview
A web attack shows up in the Nginx log before it shows up anywhere else — the credential-stuffing run, the path scan, the burst of 403s against /admin. Extracting the right fields from those logs is what makes them searchable and usable in rules.
There are three delivery methods, and one of them needs no agent at all:
| Method | When to use it | Effort |
|---|---|---|
| Native Nginx syslog output (recommended) | Nginx runs on a host or VM you control and can reach the collector over the network | Two config lines, no agent |
| File tailing with a shipper | You must keep local log files, or a log shipper is already deployed | Agent to install and maintain |
| Container logs | Nginx runs in Docker and already logs to stdout/stderr | See Docker Logs |
This guide covers the native syslog path in full, then shows how to parse the result. As always, if you have any further questions, don’t hesitate to contact our integrations team at integrations@secure60.io.

Prerequisites
- A deployed Secure60 Collector reachable from your web servers
- Nginx 1.11.8 or later if you want structured JSON logging (
escape=jsonwas added in that release) - The collector’s syslog listener open:
514/udpby default
Step 1: Decide between JSON and combined logs
Nginx can write its access log in any format you define. That choice determines how much work the platform has to do afterwards.
- Structured JSON (recommended). You name the fields in
nginx.confusing Secure60 field names, and the collector decodes them straight into the event. No parser, no regular expressions, and nothing to re-write when your URL structure changes. - Combined (the default). One line of text per request. It still works — you add a Log Parser in the portal that extracts the fields — but the parser is another thing to maintain.
Use JSON unless something downstream of Nginx already depends on the combined format.
Step 2: Configure structured JSON access logging
Add the following to the http block of /etc/nginx/nginx.conf. The map block turns the HTTP status code into a Secure60 outcome, so success and failure are usable in searches and rules without anyone having to remember which status codes mean what.
http {
    # Map the response status to a Secure60 outcome value
    map $status $s60_outcome {
        ~^[45]   failure;
        default  success;
    }

    log_format s60_json escape=json
      '{'
        '"type":"web",'
        '"operation":"http-request",'
        '"vendor":"nginx",'
        '"product":"nginx",'
        '"app_name":"nginx",'
        '"technology_group":"web",'
        '"outcome":"$s60_outcome",'
        '"host_name":"$hostname",'
        '"ip_src_address":"$remote_addr",'
        '"ip_src_port":"$remote_port",'
        '"ip_dst_port":"$server_port",'
        '"user_name":"$remote_user",'
        '"http_method":"$request_method",'
        '"http_uri":"$request_uri",'
        '"http_protocol":"$server_protocol",'
        '"http_status_code":"$status",'
        '"http_bytes_sent":"$body_bytes_sent",'
        '"http_request_time":"$request_time",'
        '"http_host":"$host",'
        '"http_referer":"$http_referer",'
        '"http_useragent":"$http_user_agent",'
        '"http_x_forwarded_for":"$http_x_forwarded_for"'
      '}';

    access_log syslog:server=<S60_COLLECTOR_IP_ADDRESS>:514,facility=local7,tag=nginx,severity=info s60_json;

    # ... rest of your http block
}
Replace <S60_COLLECTOR_IP_ADDRESS> with the address of your Secure60 Collector.
The field names above are Common Information Model names on purpose. Because Nginx emits them directly, the event that lands in Secure60 is already normalised — the same ip_src_address and http_status_code your Windows, firewall, and cloud events use.
Sites and vhosts
access_log is inherited, so a directive in the http block applies to every server block that does not override it. If one site needs different handling, repeat the access_log line inside that server block with a different tag= value — the tag arrives as app_name, which makes it easy to route or filter per site.
Step 3: Forward the error log
The Nginx error log has a fixed format, so there is nothing to define. Point it at the collector:
error_log syslog:server=<S60_COLLECTOR_IP_ADDRESS>:514,facility=local7,tag=nginx_error,severity=error;
Error-log entries arrive as text in message_text with app_name set to nginx_error. Upstream failures, permission errors, and TLS handshake problems surface here, which makes this stream as useful for availability as it is for security.
Reload Nginx once both directives are in place:
nginx -t && systemctl reload nginx
Step 4: Configure the collector
For JSON access logs, add one line to your collector .env file to decode the JSON payload out of the syslog message:
ENABLE_GENERIC_NORMALISE=true
DECODE_FIELDS_JSON_FLATTEN=message_text
The collector parses message_text as JSON and merges the resulting fields into the event. Events whose message_text is not JSON — your Linux syslog, your firewall — are left untouched, so this setting is safe to enable on a shared collector.
Restart the collector to pick up the change:
docker restart s60-collector
Keeping the volume down
The JSON payload stays in message_text after decoding, which doubles the size of every web event. Ingest volume is the main cost lever on the platform, so on a busy site it is worth removing the duplicate and dropping the requests you will never investigate:
DROP_FIELD_NAMED=message_text
DROP_EVENT_CONTAINING=http_uri=/healthz
Both settings live in Data Masking and Privacy on the Manual Configuration page — see Implement Data Masking. Drop health checks, load-balancer probes, and static asset requests before you drop anything with a user attached to it.
A second, smaller saving: an Nginx variable with no value arrives as an empty string rather than being left out, so a site with no HTTP authentication and no proxy in front of it sends an empty user_name and http_x_forwarded_for on every request. Remove the lines you do not use from the log_format.
Alternative: keep the combined format and deploy a parser
If you cannot change the log format, send the default combined log to the collector:
access_log syslog:server=<S60_COLLECTOR_IP_ADDRESS>:514,facility=local7,tag=nginx,severity=info combined;
Then deploy the Nginx parser to normalise it. Parsers are managed in the portal under Integrations → Secure60 Collector → Log Parsers, assigned to a Collector Profile, and the profile is assigned to your Collector Group — the collector picks the configuration up automatically, with no redeployment.
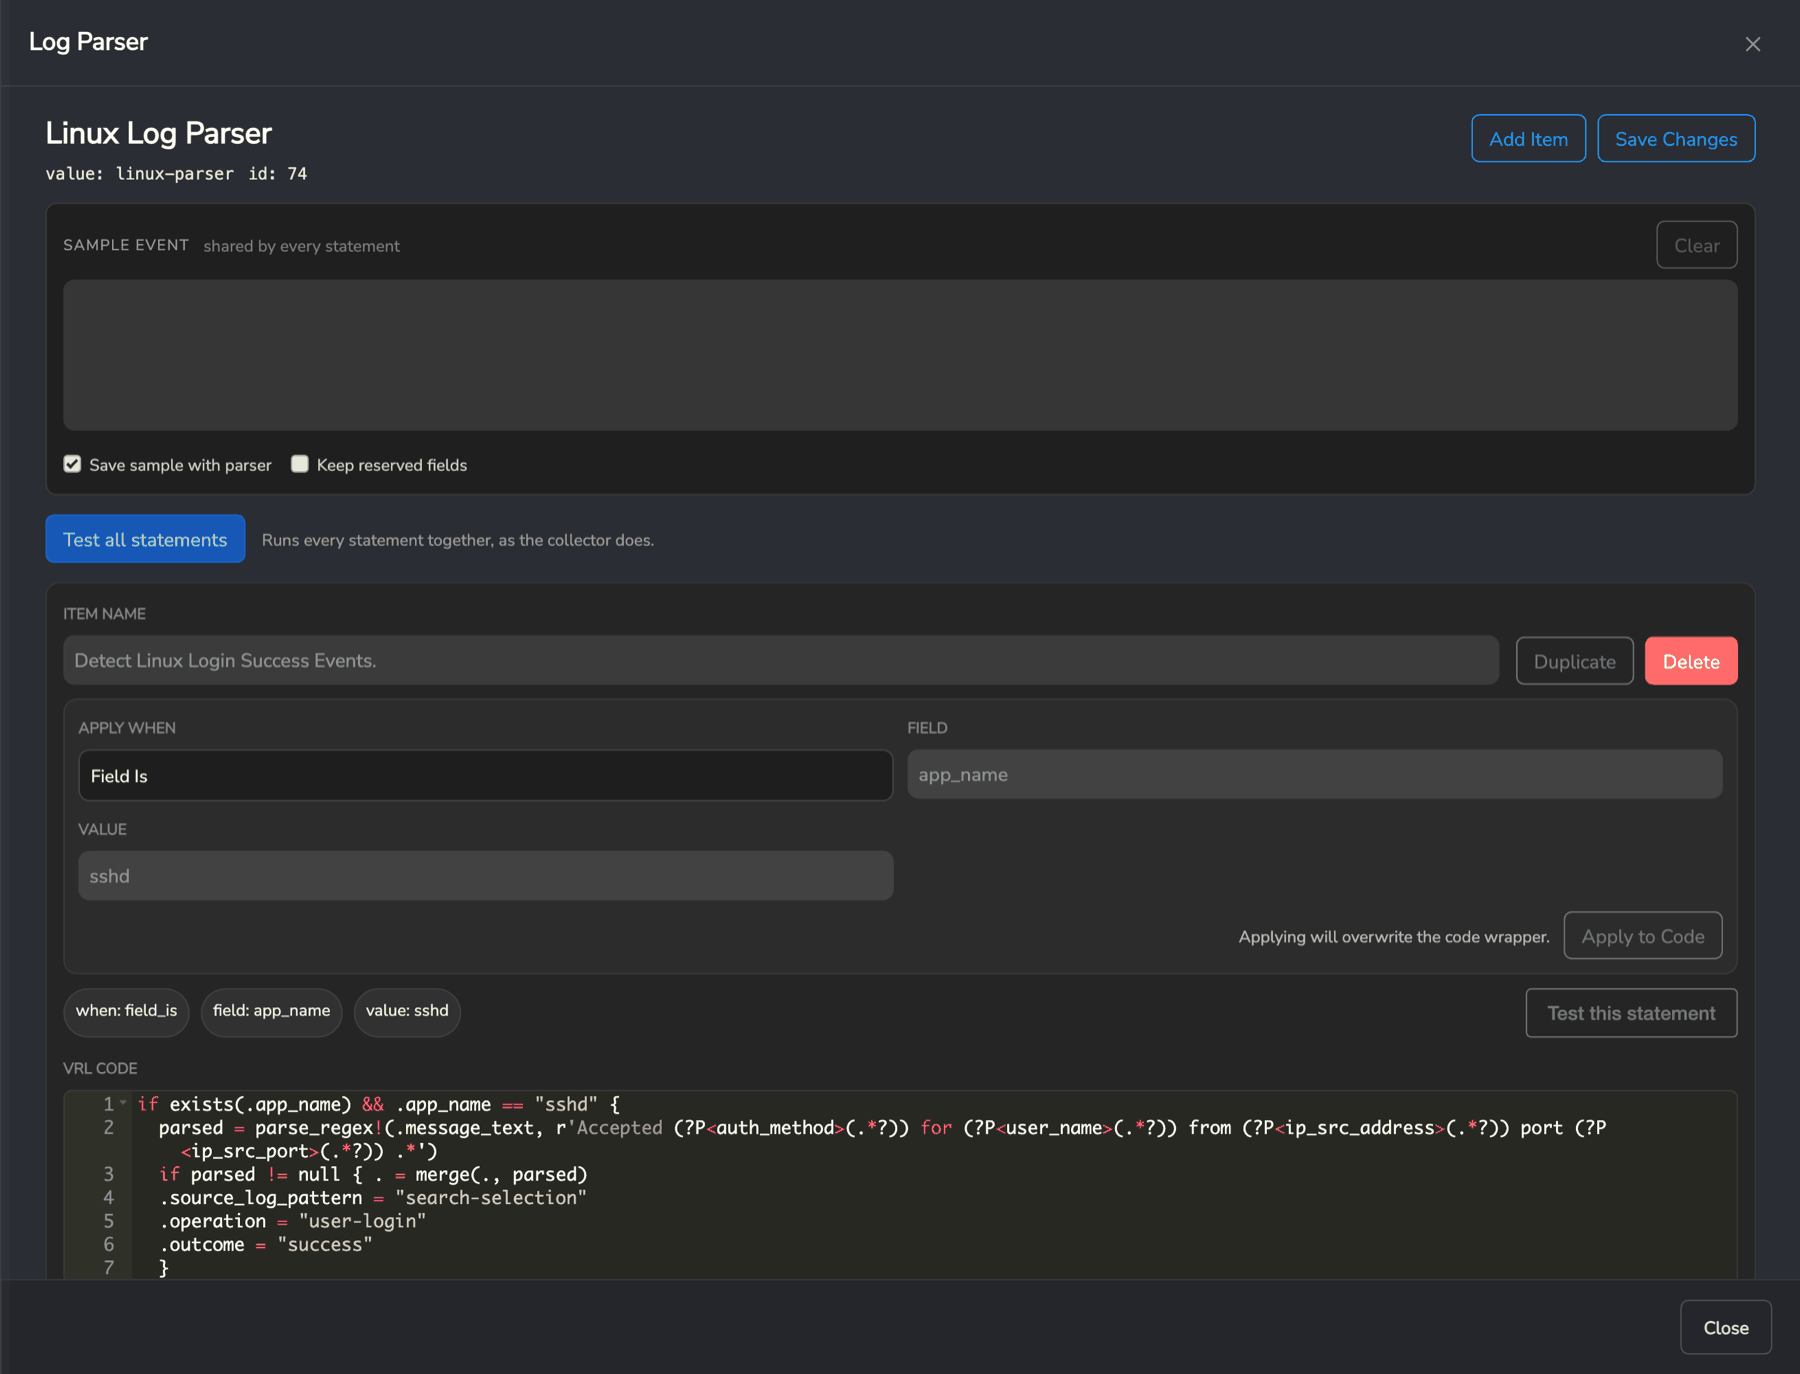
The parser matches on a condition — for this integration, Field Is on app_name with the tag= value you set above — and extracts the request line into the same fields the JSON format produces. Talk to our integrations team at integrations@secure60.io about deploying it into your account.
Alternative: the built-in Nginx transformation
The collector also ships a built-in Nginx transformation, enabled from Manual Configuration → Technology Specific Optimisations:
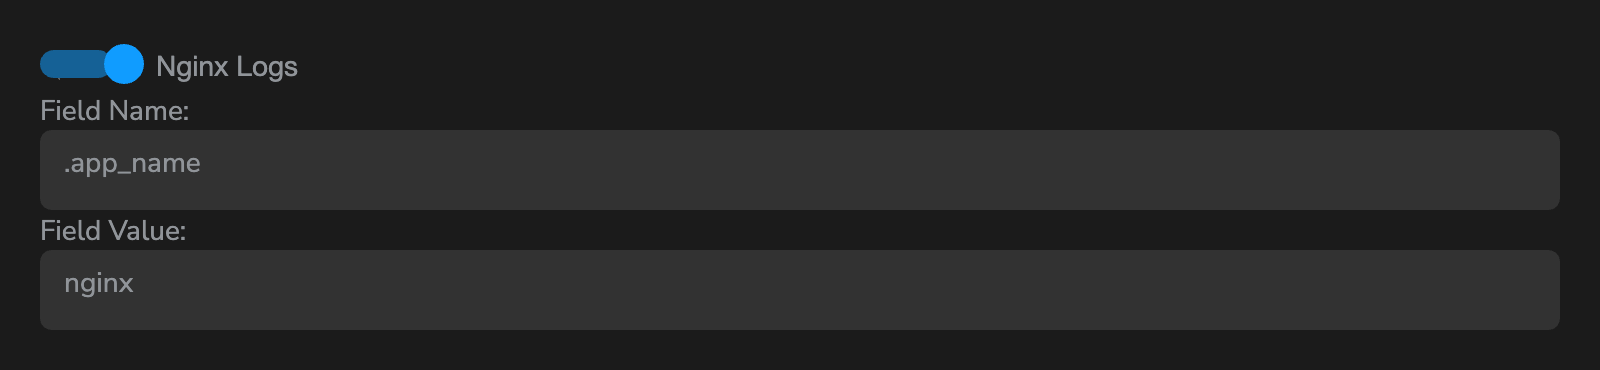
ENABLE_NGINX=true
ENABLE_NGINX_MATCH_FIELD=.app_name
ENABLE_NGINX_MATCH_VALUE=nginx
The match field is a field reference and needs its leading dot. It selects which events are routed into the transformation.
This transformation reads a file field to tell an access log from an error log, so it suits records shipped by a file-tailing agent that carries the source path. For syslog-delivered logs — which have no file field — use the JSON format from Step 2 or the Log Parser above.
Step 5: Verify the data
Open Search in the portal and query for your web events:
product=nginx
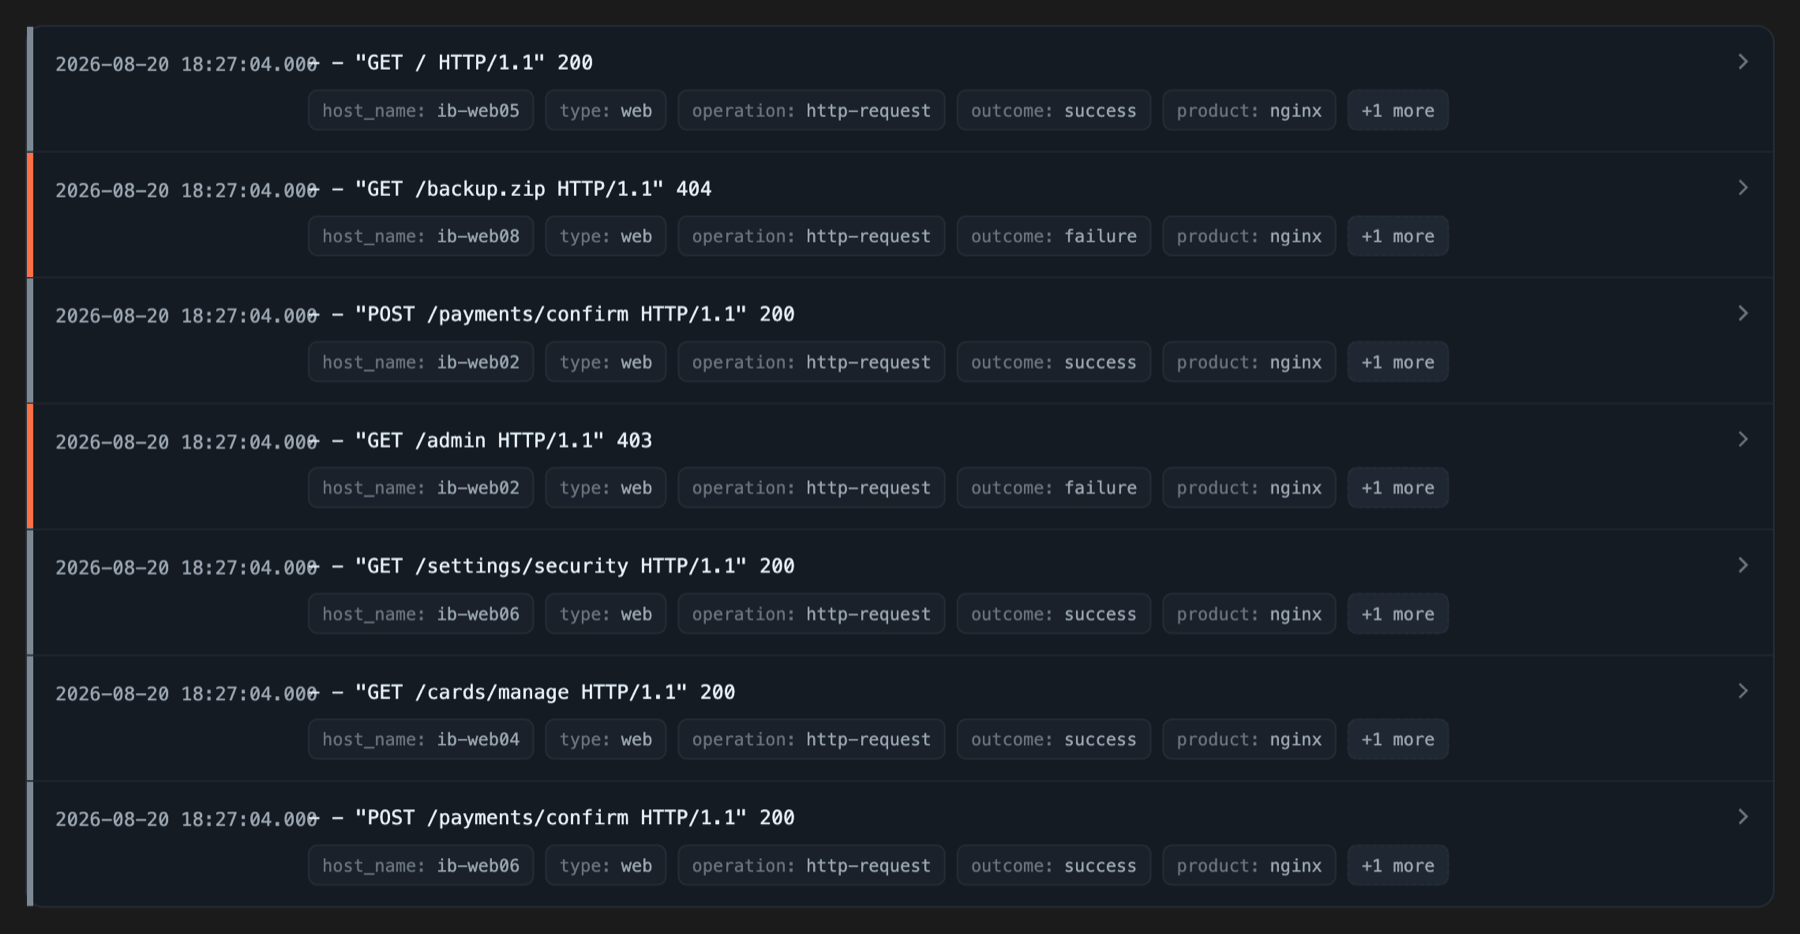
Each row should show type: web, operation: http-request, an outcome, and the host that served the request. Expand a row to confirm the HTTP fields came through. If events arrive but the fields are missing, the payload reached the collector and the decoding step is what needs attention — check DECODE_FIELDS_JSON_FLATTEN first, then confirm your log_format is valid JSON.
A few queries worth running immediately:
| Query | What it shows |
|---|---|
product=nginx AND http_status_code=404 |
Path scanning and probing for files that should not exist |
product=nginx AND http_status_code>=500 |
Application errors, before your users report them |
product=nginx AND http_uri:/admin |
Attempts against administrative paths |
product=nginx AND outcome=failure |
Everything the server refused, in one view |
See Query Syntax for the full set of operators.
What the log format produces
Each Nginx variable in the log_format above arrives as the named Secure60 field:
| Nginx variable | Secure60 field | Notes |
|---|---|---|
$remote_addr |
ip_src_address |
Automatically enriched with geo-IP and ASN data |
$remote_port |
ip_src_port |
|
$server_port |
ip_dst_port |
|
$remote_user |
user_name |
Populated when HTTP authentication is in use |
$request_method |
http_method |
|
$request_uri |
http_uri |
Full path including the query string |
$server_protocol |
http_protocol |
|
$status |
http_status_code |
|
$body_bytes_sent |
http_bytes_sent |
|
$request_time |
http_request_time |
|
$host |
http_host |
|
$http_referer |
http_referer |
|
$http_user_agent |
http_useragent |
|
$http_x_forwarded_for |
http_x_forwarded_for |
Use this as the client address when Nginx sits behind a load balancer or CDN |
$hostname |
host_name |
The web server itself, which becomes a tracked entity |
Next steps
With web events normalised, the platform can act on them:
- Detections — write rules against
http_status_code,http_uri, andip_src_address. See Create Rules. - Entity analytics — each web server and client IP is tracked over time, so a source that suddenly behaves differently is scored rather than merely logged. See Entity Analytics.
- Threat intelligence — client addresses are checked against feeds automatically. See Threat Intelligence.
Related
- Web Application Firewall (WAF) - Integration Guide — the layer in front of Nginx, and how the two correlate
- Firewall and Network Device - Integration Guide — syslog from perimeter and network equipment
- Docker Logs — for containerised Nginx
- Secure60 Collector — Collector Groups, Profiles, and Log Parsers
- Implement Data Masking — redact query-string secrets and drop noise before it is billed
- ISO 27001 A.8.15 Logging — web server logs are evidence for this control
 Back to top