Search Best Practices
This guide is about getting to an answer quickly. It assumes you already know where the Search page is — see Search for the tour of the interface, and Query Syntax for the complete grammar.
What follows is the part neither of those covers: which control to reach for, which operator is the right one, and the handful of behaviours that surprise people.
The shape of a good search
Almost every effective investigation follows the same four moves:
- Set the time range before anything else. It is the single largest lever you have.
- Ask a broad question — an open-search term, or one field you are confident about.
- Read the histogram and the Query Builder panel to find out what is actually in the data, rather than guessing field names.
- Narrow by clicking, not by typing, until the result set is small enough to read.
The last point is the one most people skip. Every filter you can add by clicking is a filter you cannot mistype, and the platform builds the clause with the correct operator, quoting and escaping for you — which matters as soon as a value contains an apostrophe or a Windows path.
Narrowing by clicking
The + and − on a field
Every field on a result carries a + and a − — on the field chips of a raw row, and on each field row of an expanded event.
- + adds
field = 'value', keeping only rows where the field holds exactly that value. - − adds
field != 'value', dropping the rows where it does.
Both are exact matches, not contains.
The part worth understanding is what happens when you use them more than once on the same field. Values of one field are collected into a single clause rather than stacked as separate filters:
| You click | You get | It means |
|---|---|---|
+ on three host_name values |
(host_name='a' OR host_name='b' OR host_name='c') |
any of these three |
− on three host_name values |
(host_name!='a' AND host_name!='b' AND host_name!='c') |
none of these three |
So including is a widening action and excluding is a narrowing one. Three includes return more rows than one include; three excludes return fewer than one exclude. That is almost always what you meant, but it surprises people who expect a second click to narrow further in both directions.
Remember that an exclusion also keeps rows that lack the field entirely — see Excluding a value also keeps the rows that lack the field.
The Query Builder panel
The panel on the left is the best first move in almost any investigation, because it tells you what is actually in your data instead of asking you to guess.
Expand a field and you get its most common values with counts. Tick the ones you care about, and the ADD TO QUERY controls beneath them come alive:
- Filter TO — keep only these values.
- Filter NOT — exclude them.
The two buttons are always visible while a field is expanded, greyed out until you have ticked something. Nothing moves when you tick — the list stays exactly where it was, which matters when you are working down a long field list.
The clauses these produce are the same ones the + and − produce, with the same any-of / none-of behaviour for multiple values.
Two habits pay off here:
- Read the counts before you filter. If one
host_nameholds 90% of the events in a window, that is usually the finding, not the noise to filter away. - Filter on values you have seen. A value you picked from this list definitely exists, spelled the way the data spells it. A value you typed may not.
Splitting the chart by a field
By default the histogram is one bar per time bucket: how much, and when. Split it by a field and it becomes one series per value of that field — which host, which application, which outcome — and the shape of the problem usually becomes obvious.
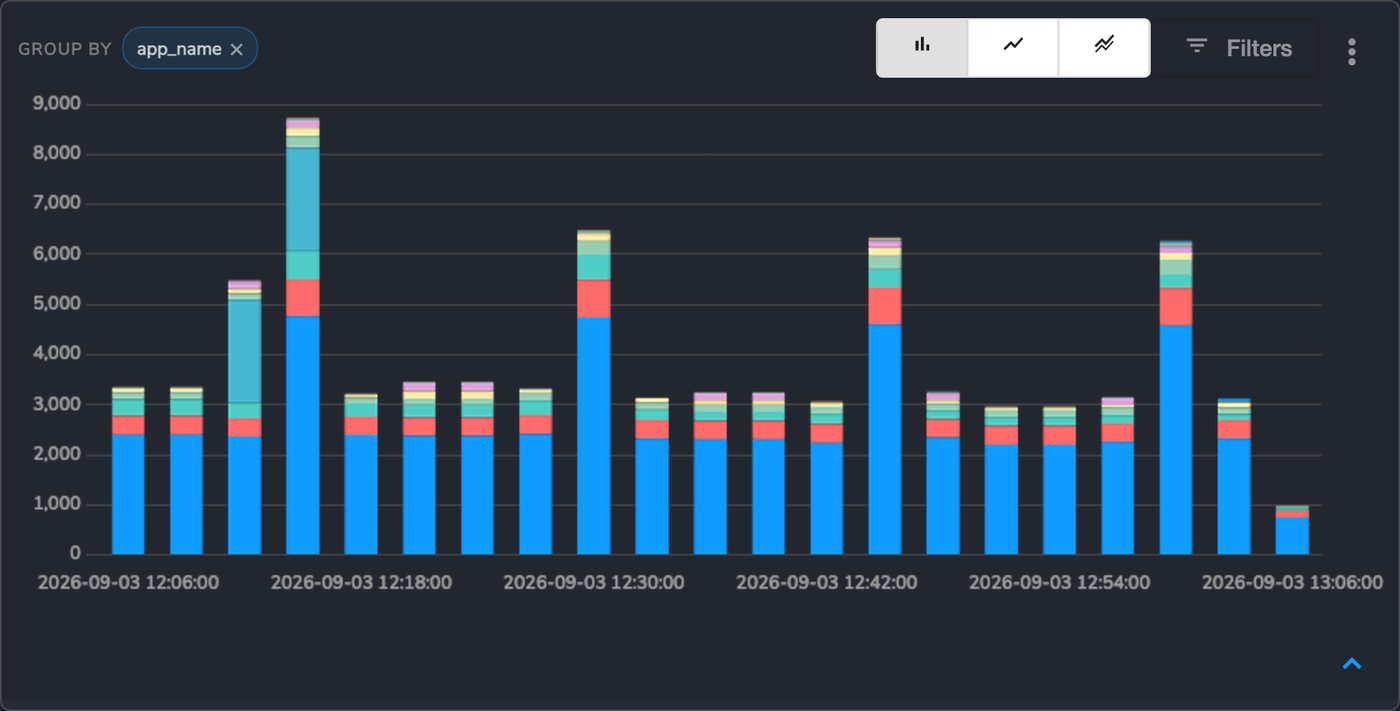
The histogram split by app_name. The GROUP BY chip names what the chart is split by, and removes it on click.
There are three ways to add one, so you can do it from wherever you already are:
- the Query Builder panel, on the row for any field it lists;
- the Columns panel on the right, which is also where you browse fields your own parsers produce;
- the histogram’s own Filters panel.
They all do the same thing. Adding a split also opens the chart and turns the legend on, since a breakdown you cannot see is not much of a breakdown.
Splits add up, they do not replace. Picking a second field gives you both, broken down together — application and host — rather than swapping the first out. You can have up to four; past that every series is a sliver and the legend stops being readable, so the chart declines and tells you which fields are already applied.
Whatever is applied shows as GROUP BY chips along the histogram header. Click a chip to remove that field. Remove the last one and the chart goes back to plain volume over time.
Splitting the chart never changes your query — it only changes how the results you already have are drawn. To turn a series into an actual filter, click it in the legend.
Filtering from the legend
When the histogram is split by a field, each series in the legend is one value of that field. Click a legend entry to filter the search to that series — the quickest way to go from “one of these lines is the spike” to “show me only that”. The filter arrives as a removable chip beneath the search bar, so you can undo it with one click.
This works when exactly one field is applied. The reason is worth knowing, because otherwise the behaviour reads as a bug:
- With no split there is only one series covering everything, so there is no value to filter to.
- With two or more fields each series is labelled with the values run together, and
nothing marks where one ends and the next begins. Splitting by application and host gives a
series called
audisp-syslog-cloud-collector-mani, which is the applicationaudisp-syslogand the hostcloud-collector-mani— but it could just as well be read asaudispandsyslog-cloud-collector-mani. A label like that cannot be turned back into a filter, so the chart does not pretend it can.
When the legend cannot filter, clicking it does nothing at all, and a Legend filter off note appears beside the GROUP BY chips — its tooltip explains which fields are in the way and that removing one turns filtering back on. That is deliberate. A click that quietly did something else instead would be worse than a click that does nothing, once you have learned what the legend is for.
The blank series is filterable like any other. A series with no label is the rows where that field is empty, and clicking it filters to exactly those.
Choosing the right operator
| Operator | Matches | Reach for it when |
|---|---|---|
= |
The whole field, exactly, case sensitive | You know the value. This is the fastest filter in the product. |
!= |
Everything except that exact value | Excluding one known noisy value |
: |
The value anywhere in the field, case insensitive | You know a fragment — a domain, a process name, part of a path |
!: |
Rows where that fragment is absent | Excluding a family of values, e.g. every URL containing /healthz |
> >= < <= |
Numeric comparison | Byte counts, durations, status codes, event counts |
~ |
RE2 regular expression | Nothing simpler will express it |
Two habits are worth forming.
Prefer = when you know the value. It is both the most precise operator and the cheapest
one to answer. host_name = 'web-01' is a different class of query from host_name : 'web' —
and the second one also matches web-02, webmail, and nonweb-01.
Treat ~ as a last resort. Regular expressions cannot be answered from an index, so every
regex search reads the whole time window. They are the right tool for a genuinely irregular
pattern, and the wrong tool for something : already expresses. Keep regex searches to short
windows — minutes to hours, not weeks.
Where the value sits in the field
The : operator matches anywhere in the field by default. You only need a % when you want to
anchor the match:
| Written | Matches |
|---|---|
app_name : 'sshd' |
anywhere in the field — the default |
app_name : 'sshd%' |
field starts with sshd |
app_name : '%sshd' |
field ends with sshd |
You do not need to write '%value%'. Older documentation and older saved rules do, because it
used to be required; it still works and means the same thing as the plain form.
Beyond fields: the functions
Some questions are not about a field at all. These are worth knowing because each one replaces a query people otherwise write badly by hand:
isEntity('Web 01')— all activity belonging to a registered entity, matched across every identifier you have recorded against it. A host known by a hostname and two IP addresses is matched by all three from this one clause. Hand-writing(host_name='web-01' OR host_name='10.1.2.3')does not work, because the second value never appears inhost_name— it appears inip_src_address.isEntityGroup('Production')— the same, for every member of a group.isInList('42', 'ip_src_address')— match a field against a maintained List, so the query stays stable while the values change.isField('process_name')— rows where the field is present at all, whatever its value. Useful for finding which log sources carry a field before you filter on it.isIPAddressInRange('ip_src_address', '10.0.0.0/8')— subnet matching, rather than a text prefix that gets10.1.xand101.xconfused.!isBusinessHours('08', '18', 'Australia/Sydney')— after-hours activity, including weekends. The timezone is an argument, so the same query works for any office.isOlderThanDays('30')/isNewerThanDays('7')— age relative to the record’s own timestamp.
Every function has a ! form. There is no NOT keyword in the language — the ! prefix is
how negation is spelled.
Narrowing efficiently
Two searches that return the same rows can differ by orders of magnitude in how much work they take. The difference is almost always whether the platform can use an index to skip data, or has to read the whole window.
The time range does the most work
Everything else is secondary. A filter that reads a 1-hour window and a filter that reads a 30-day window are not comparable, however well written the query is. Start narrow and widen only when you have to — the histogram will tell you whether you have gone narrow enough to see the shape of the activity.
If you know roughly when something happened, brush the histogram to zoom to that window rather than searching the whole day.
Which filters take the fast path
| Filter | Fast path |
|---|---|
= on a core field |
Yes — the cheapest search available |
: / !: on a core field |
Yes, provided the value is 5 characters or longer |
| A custom field from your parsers | Searchable, but reads more data than a core field |
~ regex |
No — reads the whole window |
!=, >, < |
No — reads the whole window |
| Open search | No — reads the whole window |
The core fields are the ones every event has, whatever produced it: message_text,
host_name, user_name, ip_src_address, ip_dst_address and app_name.
Three practical consequences:
- A fragment shorter than five characters cannot be skipped over.
app_name : 'ssh'reads far more thanapp_name : 'sshd 'does. Where you can be more specific, be more specific. - Negation never narrows the read.
!=and!:still have to look at every row to find out which ones to drop. Pair an exclusion with a positive filter — narrow first, then exclude the noise from what is left. - Custom fields cost more than core fields. A field your parser produces is stored alongside all the other custom fields for that event, and reading one reads the set. This is fine on a narrow window and expensive on a wide one. If you filter on the same custom field constantly, talk to Secure60 Support about promoting it.
Open search: excellent first move, poor standing filter
Open search — typing bare words with no field name — searches across the five common fields at once. It is the right way to start when you do not yet know where a value lives, and it is genuinely fast to type.
It is not the right way to finish. Because it asks five questions at once, it cannot use an index, so it reads every row in the window. Once open search has shown you which field your term actually lives in, replace it with a field filter on that field. The rest of the investigation will be much faster.
Start:   payment-gateway
Finish:  host_name = 'payment-gateway-02' AND outcome = 'failure'
An order of operations that works
- Time range — as narrow as the question allows.
- One exact filter on a core field, if you have one.
- Contains filters to refine.
- Exclusions last, against the already-narrowed set.
- Regex only if steps 2–4 could not express it, and only on a short window.
Traps worth knowing about
Excluding a value also keeps the rows that lack the field
This is the one that catches everyone. A missing field reads as an empty value, and an empty value is not equal to the thing you excluded — so it survives the filter:
outcome != 'success'
returns failures and every event that has no outcome field at all. That is usually the
correct reading of “exclude successes”, but it is not the same as “only events with a different
outcome”. When you want the stricter meaning, say so:
outcome != 'success' AND outcome != ''
The same applies to !: and to exclusions added by clicking.
= cares about case and : does not
user_name = 'Admin' and user_name = 'admin' are different searches. user_name : 'admin'
finds both. When a search returns nothing and you expected rows, case is the first thing to
check.
A value ending in a backslash needs two
Windows paths run into this constantly. The closing quote is consumed by the trailing backslash and the query is rejected with Unterminated string literal in query:
| Write this | Not this |
|---|---|
process_image : '%C:\Windows\\' |
process_image : '%C:\Windows\' |
A backslash in front of anything else is just a backslash, so '%\rundll32.exe' needs no
escaping at all.
Regular expressions need their backslashes twice over
Regex values are the one exception to the escaping rules — the pattern is handed to the regex engine with its backslashes still to resolve, so a backslash the pattern needs has to be written twice:
process_target_image ~ '\\\lsass.exe$'
If a regex silently matches nothing, this is usually why.
isEntity() takes the name, not an identifier
isEntity('Web 01') is right. isEntity('10.1.2.3') matches nothing, even when that address is
one of the entity’s identifiers — the whole point of the function is that you give it the name
and it resolves the identifiers for you. Use the name exactly as it appears on the Entities
page.
A newly created entity, or a new identifier on an existing one, takes up to a minute to become searchable.
A populated histogram with an empty result list means retention
If the timeline shows bars but the results say NO DATA FOUND, you have searched past your project’s log retention period. Summarised counts are kept longer than the log lines themselves, so the chart can describe a window whose individual events have already been removed. Shorten the time range, or check your project’s retention setting.
There is a ceiling on how many values one filter can hold
Selecting several hundred values of a high-cardinality field — every host_name in a large
estate, for instance — eventually exceeds what a single filter can carry, and the page will
tell you so with a count rather than failing obscurely. If you need to match a large set
routinely, put the values in a List and use
isInList('<list_id>', '<fieldname>'). The list can then be maintained without touching the
query.
Timestamps are stored in UTC
Displayed times follow your user timezone, but the stored timestamp is UTC. Where a query needs to reason about local time — business hours, weekends — use the time functions and pass your timezone explicitly, rather than doing the arithmetic yourself.
Rules do not get the whole language
Everything above applies to the Search page. Streaming rules — those that evaluate each
event as it arrives — match text exactly and support neither wildcards, regex, nor the
functions. A % in a streaming rule is matched as a literal percent sign. Build the query in
Search first, then check it against the constraints in
Create Rules before saving it as a rule.
Keeping what you found
A search that took effort to build should not have to be rebuilt.
- The URL is the search. Once you run it, the query, filter chips, time range, columns and layout are all in the page URL. Copy the link to hand a colleague the exact view you are looking at.
- Save a View for anything you return to. A view per workflow — “auth failures”, “firewall denies” — beats one general-purpose search you re-narrow every morning.
- Create a rule from the search when it describes something you want caught every time, rather than something you happened to look for today.
- Add the chart to a report when the shape over time is the interesting part.
- Export when the analysis belongs somewhere else. Large result sets should use Background Export, which queues the job and lets you collect it when it is ready.
A worked example
An alert says a server is being brute-forced. The instinct is to search 30 days of
message_text : 'failed'. That reads everything and answers nothing.
Instead:
1. Set the time range to the 60 minutes around the alert.
2. Open search:  authentication failure
3. Read the Query Builder panel — host_name is dominated by one host.
4. Filter TO that host.
5. Split the histogram by user_name to see whether it is one account or many.
6. Replace the open-search term with the field filter it turned out to be:
      host_name = 'app-03' AND outcome = 'failure'
7. Widen the time range now that the query is cheap, to find when it started.
The order matters. Step 7 is affordable only because steps 4 and 6 made the query index-friendly first — widening the window on the step-2 query would have been the expensive search you were trying to avoid.
For the full grammar, see Query Syntax. For the interface itself, see Search.
 Back to top