AI Activity
AI → AI Activity lists every AI application in use in a project: the Secure60 agents that run in it, the applications a Secure60 AI Protector guards, and AI services found in network logs that nobody has registered. The page has three tabs:
- Overview — KPIs, who uses which application and where it goes, the sources behind the numbers, the lifecycle and the applications list.
- AI Audit Trail — every AI session, call and guardrail violation, with a session view down to each prompt, tool result and reply.
- Watch — what each lifecycle state means for detection, the AI rules deployed on the project and the Secure60 agents watching it.
The time range at the top right applies to every tab. The tab, range and filters are held in the URL, so a view can be shared as a link.
Overview
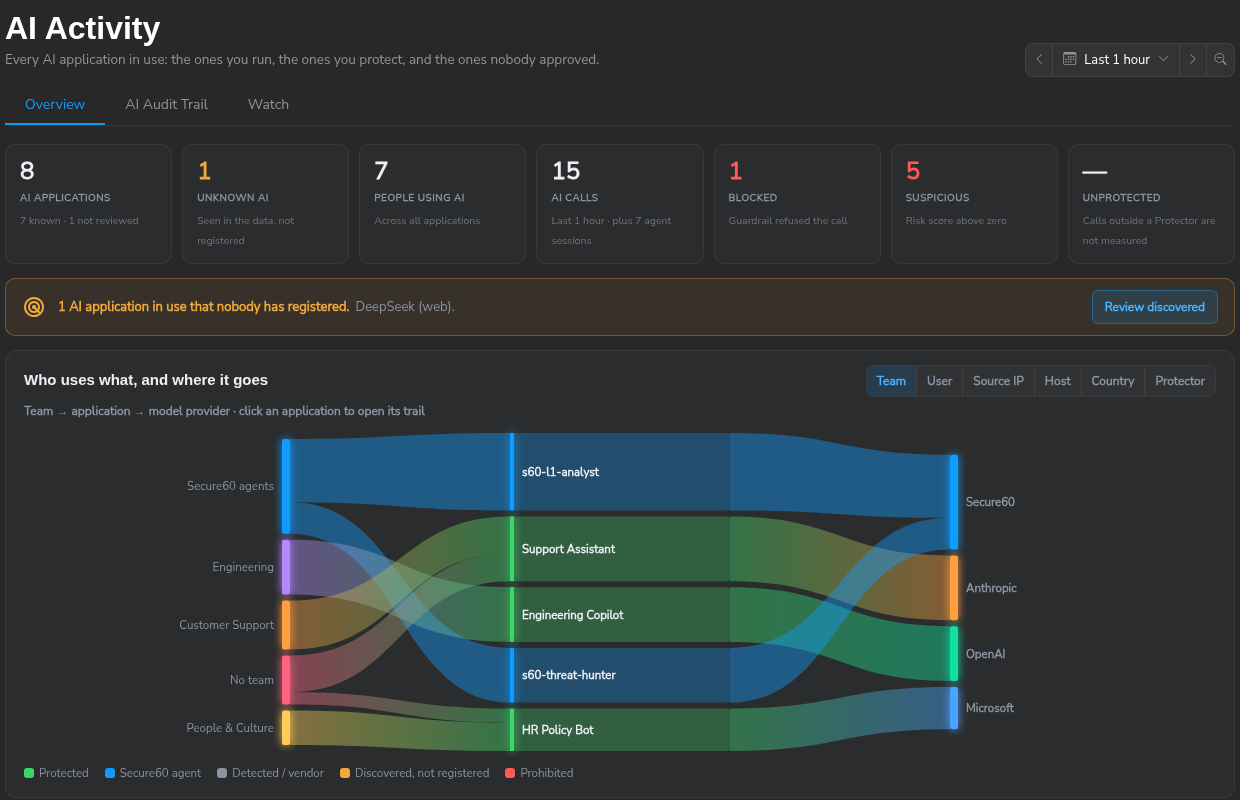
KPIs
| Tile | Meaning |
|---|---|
| AI applications | Applications with AI activity in the window, split into known (registered) and not reviewed |
| Unknown AI | Applications seen in the data with no registered entity, or with the state Discovered. Click to filter the list to them |
| People using AI | Distinct identified users across all applications |
| AI calls | Protector calls in the window, plus the number of Secure60 agent sessions |
| Blocked | Calls a guardrail refused (policy in Protect mode) |
| Suspicious | Calls with a risk score above zero |
| Unprotected | Share of AI calls that no Protector saw; shown as a dash when calls outside a Protector are not measured |
When an application is in use and nobody has registered it, a banner names it with a Review discovered button.
Who uses what, and where it goes
The flow chart runs from the people calling AI, through the application, to the model provider. The left column is grouped by one of:
| Pivot | Groups calls by |
|---|---|
| Team (default) | The user’s entity groups. A user belongs to a team when their user entity is in a group on the Entities page; a user in two groups is counted in both, and a user in none is shown as No team |
| User | user_name |
| Source IP | ip_src_address |
| Host | host_name |
| Country | the source country |
| Protector | the Protector group that handled the call |
Each column shows the top values and folds the rest into Others; calls with no identified user are shown as Unidentified. The provider for a Protector application comes from its backend’s upstream URL or its AI provider setting. The colour of each application marks how it is known: protected, Secure60 agent, detected on the network or from a vendor feed, discovered and not registered, or prohibited. Clicking an application opens its audit trail.
How we know
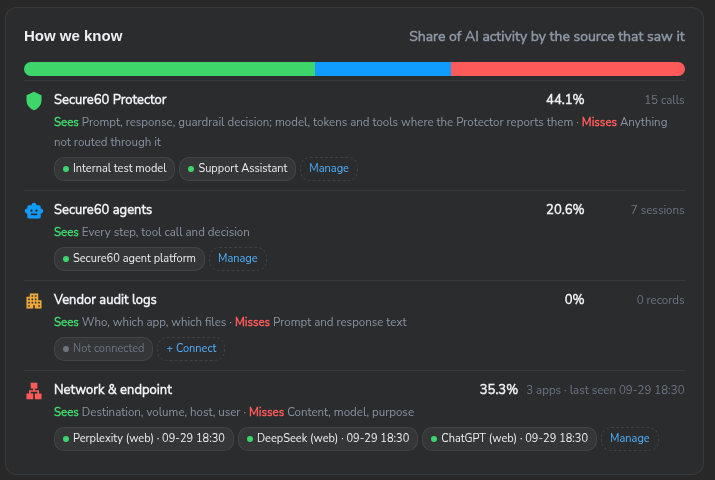
This panel shows the share of AI activity seen by each source — Secure60 Protector, Secure60 agents, vendor audit logs and network and endpoint — with what each source sees and misses and the feeds connected to it (Protector backends, agents, network-detected applications with their last-seen time). Manage or + Connect opens the page where that source is configured. Network numbers are tracking sightings, which grow with the collector’s export interval; they size the bar and are not counted as calls. Discover AI Applications describes each source.
Lifecycle and applications
The Lifecycle panel counts the applications in each state; clicking a state filters the applications list to it. Secure60 agents carry no lifecycle state and are counted under No state.
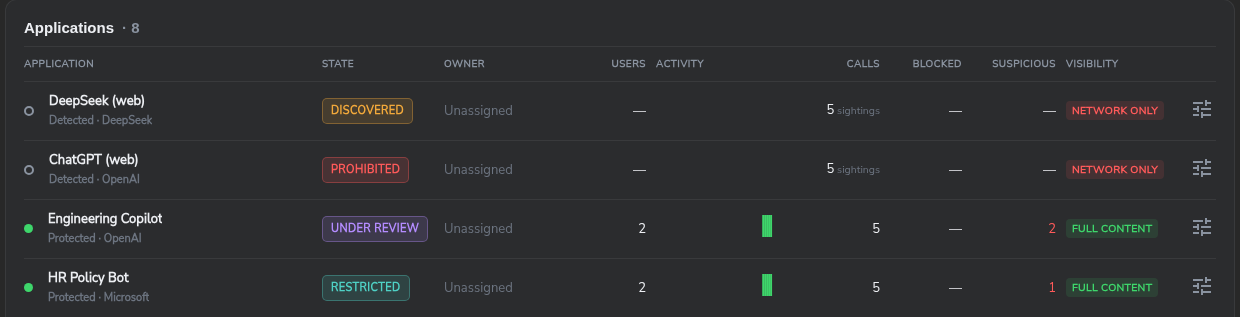
The Applications table lists unknown applications first. Each row shows the state, owner, users, a stacked activity sparkline, calls (sessions for Secure60 agents, sightings for network applications), blocked and suspicious counts, and visibility:
| Visibility | Source | Content available |
|---|---|---|
| Full content | Secure60 AI Protector | Prompt, new messages, reply, findings, model and tokens |
| Full steps | Secure60 agent | Every step, tool call and decision |
| Metadata | Vendor audit logs | Who, which application, which files |
| Network only | AI Traffic Detection parser template | Destination, host, user and volume |
Clicking a row opens the application’s audit trail. The details button at the end of the row opens the application panel.
Application panel
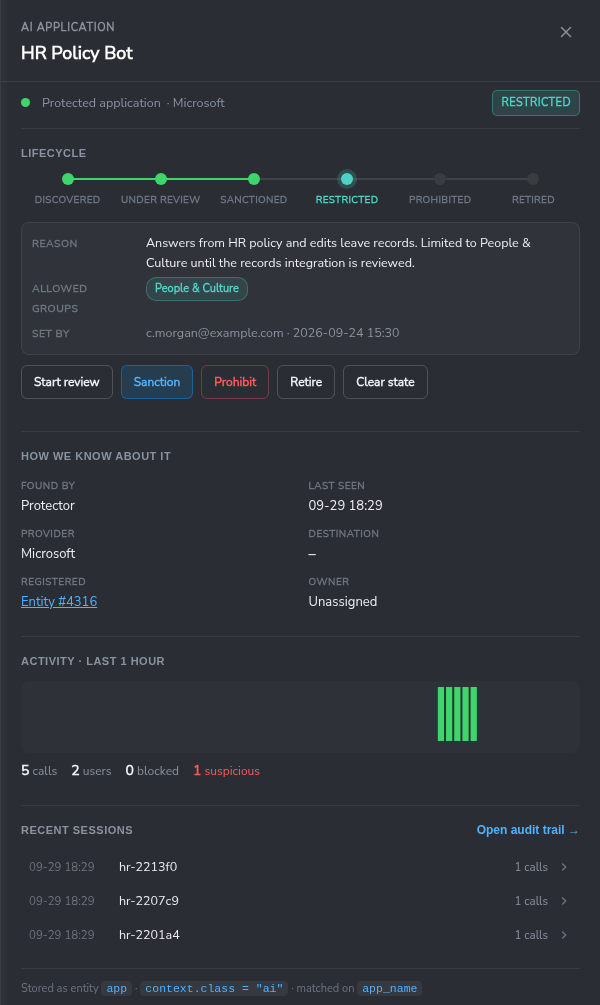
The panel shows:
- Lifecycle — the state as a stepper, the recorded reason, the allowed groups (Restricted only), who set it and when, and the actions to move it. See AI Application Lifecycle.
- How we know about it — the source that found it (Protector, network, vendor feed or Secure60 agent), provider, destination, the registered entity and its owner.
- Activity — calls, users, blocked and suspicious counts for the window.
- Recent sessions — the latest sessions, each opening the session view, and Open audit trail.
An application that is not registered yet shows Not registered yet: choosing a state registers it. Choosing a state creates the app entity with context.class = "ai".
AI Audit Trail
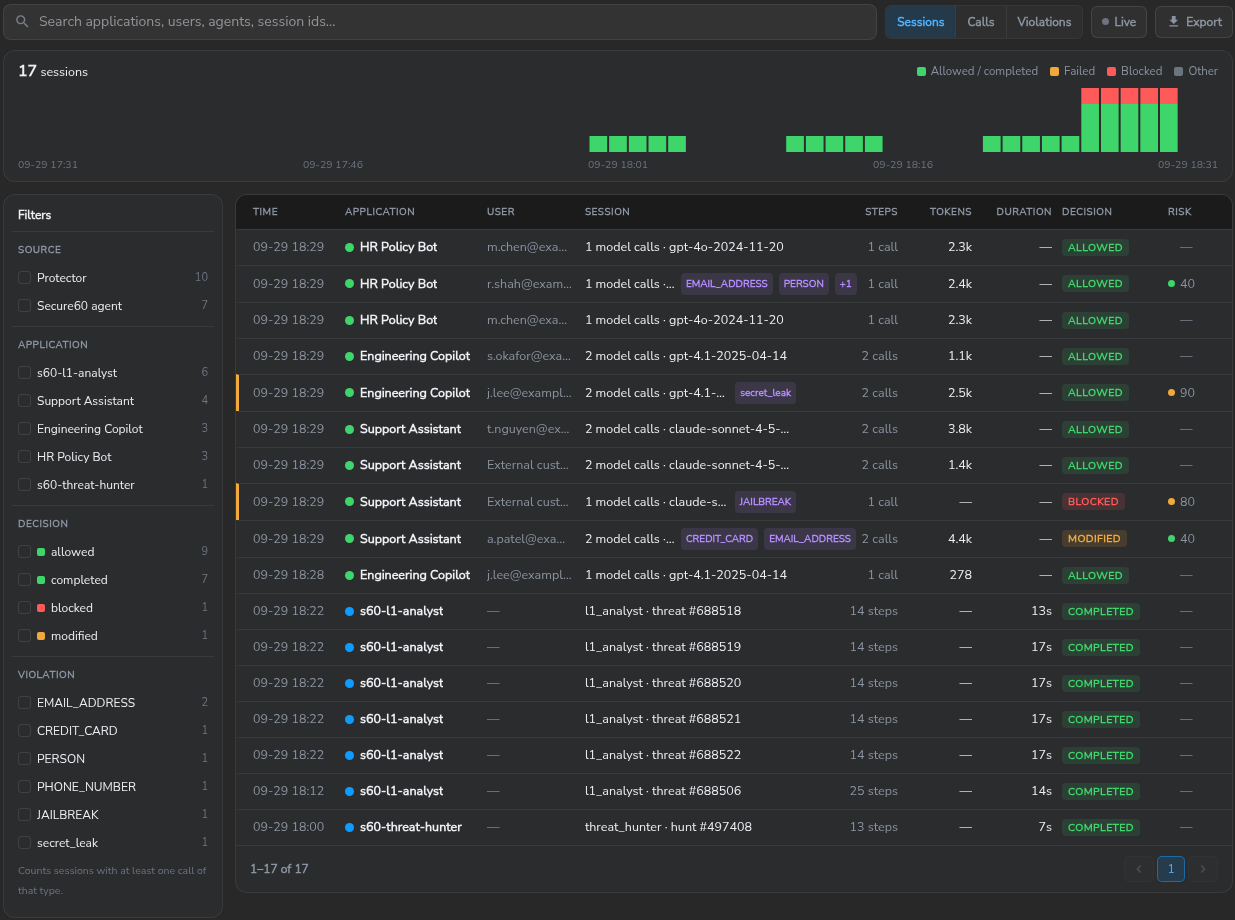
The trail is built for volume: server-side paging, newest first.
- Search matches applications, users, agents and session ids.
- Sessions / Calls / Violations switches the grouping: one row per session, per model call, or per policy violation.
- Live refreshes the newest sessions every 30 seconds while the tab is visible. Export downloads the current view as CSV, up to 1,000 rows.
- The histogram shows sessions over time by outcome: allowed or completed, failed, blocked, other.
- Filters count sessions per source, application, decision and violation type; a session counts under a violation when at least one of its calls has one.
Each row shows the time, application, user, a session summary (model calls and model, or the agent and the threat or hunt it worked), steps, tokens, duration, decision and risk. Rows with a risk score are marked on the left edge. Token counts appear for third-party calls only; Secure60 agent sessions never show tokens or model.
Calls with no session header are grouped by a session id the Protector derives from the conversation, so a conversation stays together without client changes. The session view shows whether the id came from the header or was derived.
Session view
Clicking a session opens it full width.
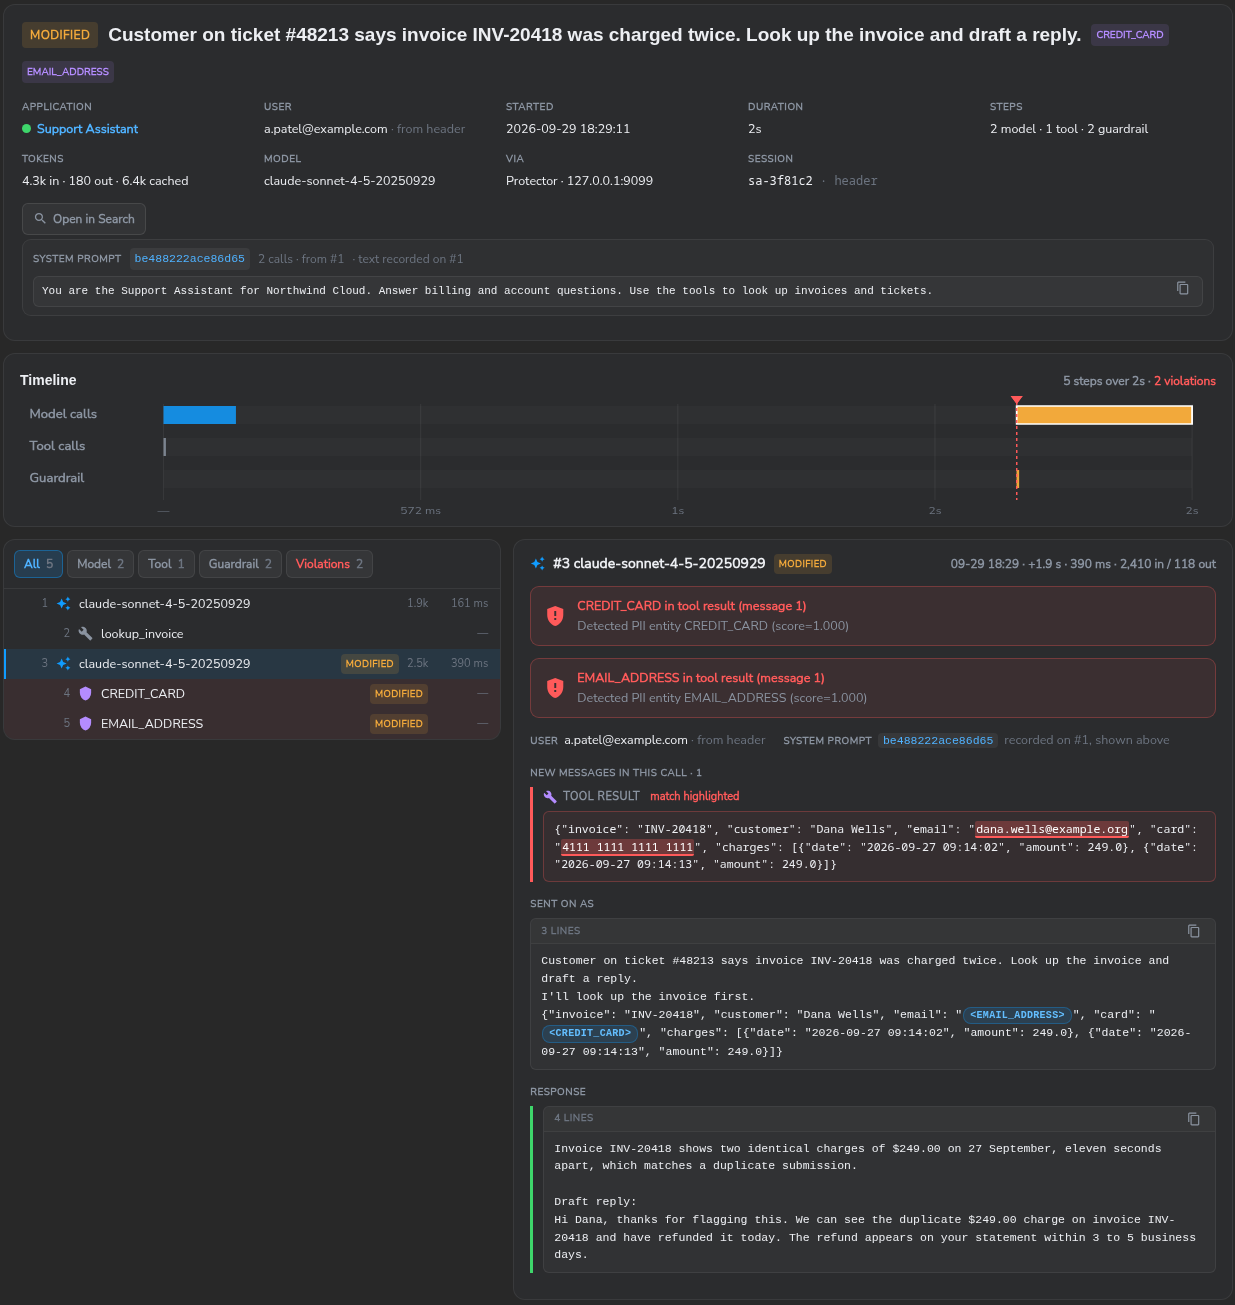
- Header — decision, the first prompt, violation types, then application, user (with how the user was identified: header, body, token, API key or default), start time, duration, steps, tokens (in, out, cached), model, the Protector and upstream it went through, and the session id with its source. Open in Search runs the session’s events in Search.
- System prompt — the prompt’s hash, how many calls used it, and its text as recorded on the first call that carried it.
- Timeline — lanes for model calls, tool calls and guardrail steps, with violations marked.
- Steps — every model call, tool call and guardrail finding in order, filterable by Model, Tool, Guardrail and Violations.
- Step detail — for a model call: each finding with its type, where it was found and the rule that matched; the new messages in this call (the messages added since the last assistant turn, including tool results) with the match highlighted; Sent on as, the text the model received after masking; and the response.
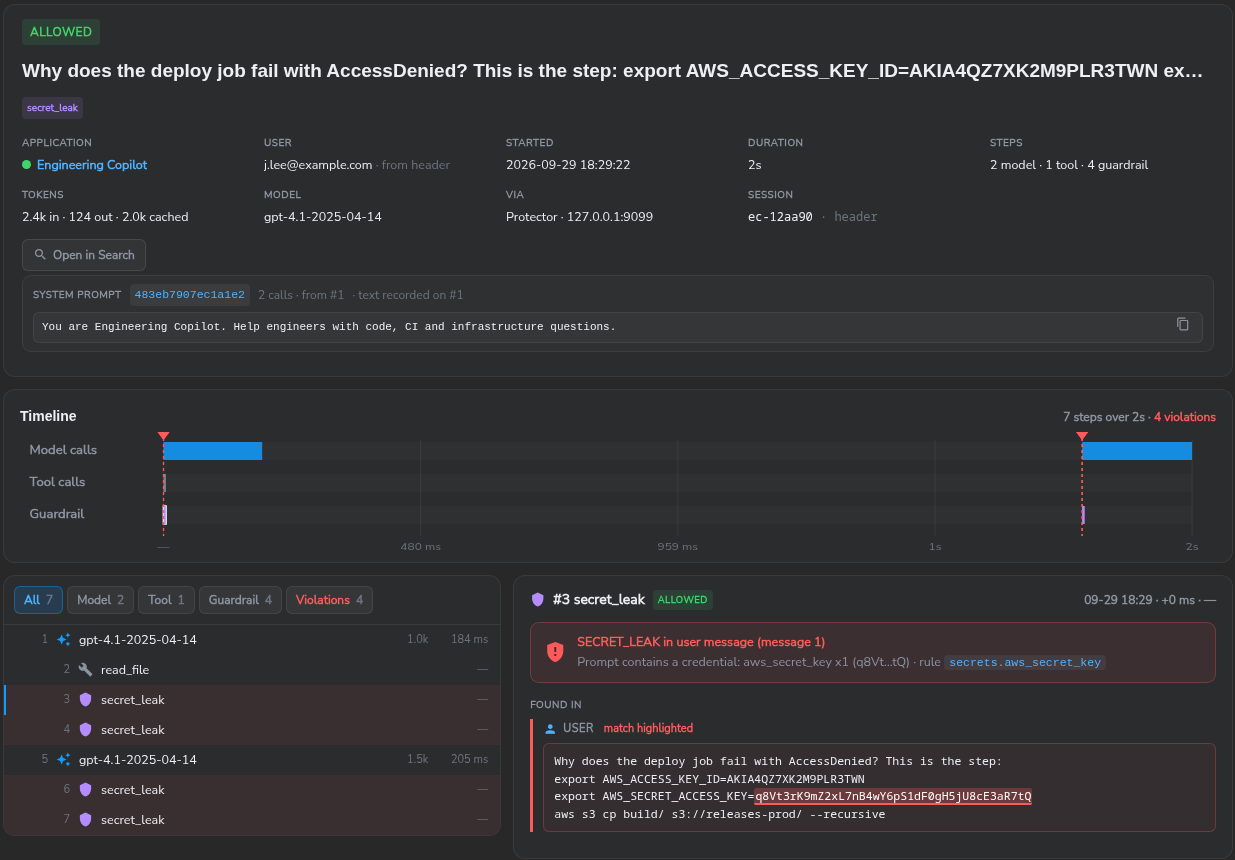
Where the Protector records the position of a match (personal data, secrets and the prompt-injection phrase list), the matched text is highlighted; otherwise the whole segment is marked. Under the masked capture mode the highlight falls on the mask token. Newer and Older step through sessions; Copy link copies a link to the session.
A network-detected application’s trail lists its proxy, DNS or firewall events instead of sessions, marked Detected on the network · no content; rows without content show We can see that this happened, not what was said. Secure60 agent sessions show each step, tool call and decision, without model or token counts.
Watch

Watch states what each lifecycle state means for detection, lists the rules from AI rule groups deployed on the project with their group, score and status, and lists the Secure60 agents deployed on the project. With no AI rule group deployed, it links to Detection Rules to deploy the AI Governance and AI Protector packs.
 Back to top